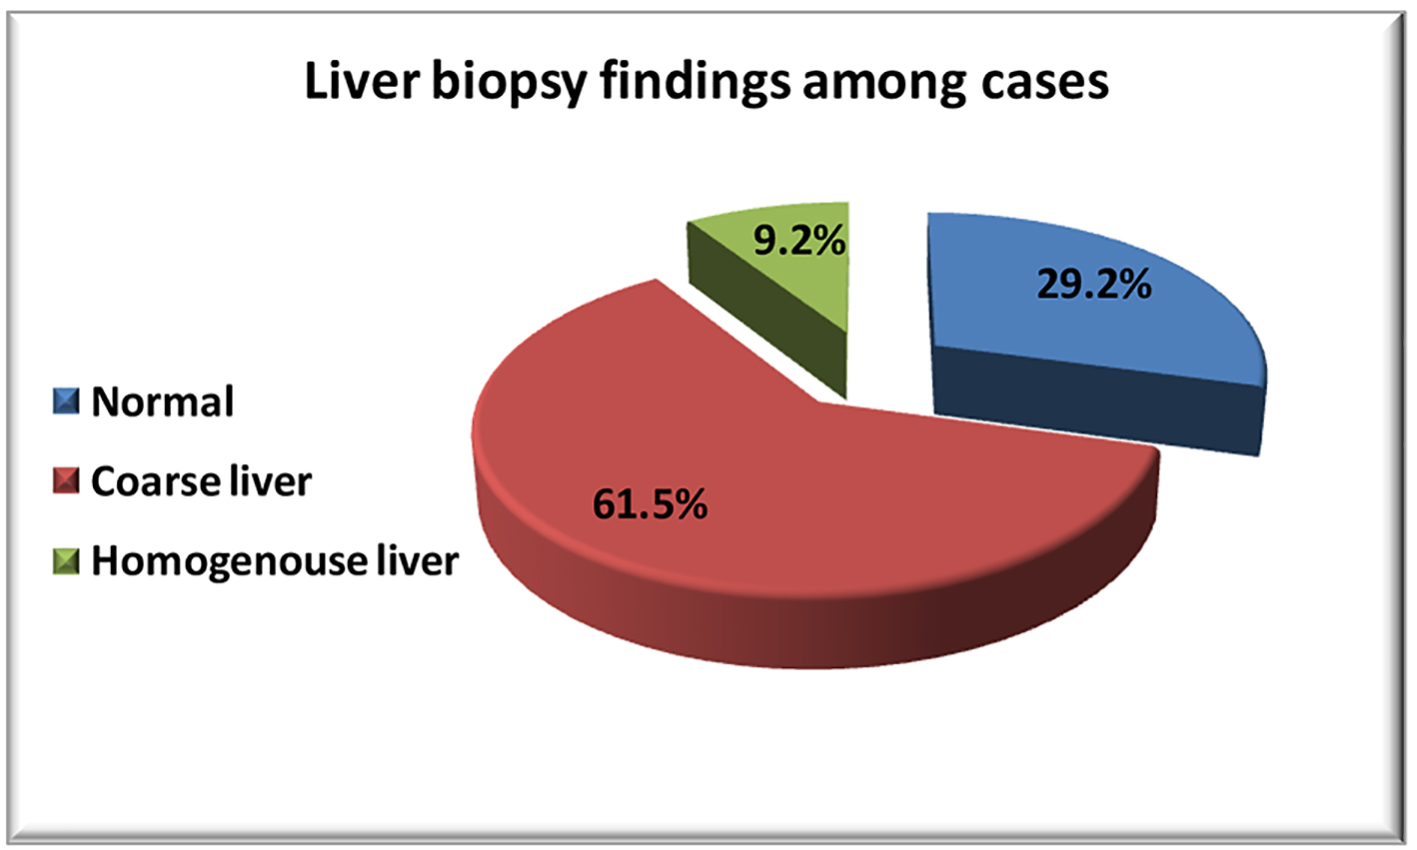
Figure 1. Liver biopsy findings among cases.
| Journal of Clinical Medicine Research, ISSN 1918-3003 print, 1918-3011 online, Open Access |
| Article copyright, the authors; Journal compilation copyright, J Clin Med Res and Elmer Press Inc |
| Journal website http://www.jocmr.org |
Original Article
Volume 9, Number 5, May 2017, pages 416-425
Role of LncRNA-AF085935, IL-10 and IL-17 in Rheumatoid Arthritis Patients With Chronic Hepatitis C
Figures
Tables
| Variables | Cases (n = 65), mean ± SD | Control (n = 30), mean ± SD | P-value |
|---|---|---|---|
| Age (years) | 39.4 ± 11.7 | 41.5 ± 8.4 | 0.4 |
| BMI | 27.6 ± 2.1 | 26.1 ± 3 | 0.1 |
| Sex, no. (%) | |||
| Male | 47 (72.3%) | 19 (63.3%) | 0.5 |
| Female | 18 (27.7%) | 11 (36.7%) |
| Variables | Cases (n = 65), mean ± SD | Control (n = 30), mean ± SD | P-value |
|---|---|---|---|
| AST | 45.1 ± 14.6 | 27.1 ± 7.5 | < 0.001 |
| ALT | 52.7 ± 10.6 | 26.3 ± 7.8 | < 0.001 |
| Total bilirubin | 0.74 ± 0.16 | 0.96 ± 0.21 | < 0.001 |
| Direct bilirubin | 0.23 ± 0.11 | 0.26 ± 0.14 | 0.2 |
| Albumin | 4.1 ± 0.48 | 4.3 ± 0.59 | 0.06 |
| Alkaline phosphate | 68.9 ± 24.6 | 81.9 ± 28.2 | 0.02 |
| PC | 0.88 ± 0.07 | 0.91 ± 0.06 | 0.02 |
| INR | 1.08 ± 0.10 | 1.1 ± 0.12 | 0.3 |
| Creatinine | 0.93 ± 0.29 | 0.93 ± 0.29 | 0.9 |
| HbA1c | 5.4 ± 0.78 | 5.33 ± 0.94 | 0.8 |
| TSH | 1.63 ± 0.98 | 1.89 ± 1.5 | 0.3 |
| AFP | 13.2 ± 6.3 | 3.33 ± 2.1 | < 0.001 |
| RBS | 87.6 ± 23.3 | 95.7 ± 26.2 | 0.1 |
| Hb (g) | 13.2 ± 2.3 | 10.8 ± 1.1 | < 0.001 |
| TLC (× 1,000) | 6.4 ± 1.9 | 4.2 ± 1.2 | < 0.001 |
| Platelets | 273.6 ± 103.5 | 181.1 ± 69.4 | < 0.001 |
| Variables | G1: before treatment (n = 65), mean ± SD | G2: after treatment (n = 65), mean ± SD | G3: control (n = 30), mean ± SD | P-value |
|---|---|---|---|---|
| aSignificance between G1 and G2. bSignificance between G1 and G3. cSignificance between G2 and G3. | ||||
| HCV RNA | 323,955 ± 337,313.6 | 1418,729.7 ± 2,380,203.2 | 0.001a | |
| IL-10 | 68.5 ± 24.7 | 201.4 ± 31.9 | 51.9 ± 20.3 | < 0.001a, b, c |
| IL-17 | 227.9 ± 35.5 | 112.4 ± 28.1 | 53.4 ± 20.7 | < 0.001a, b, c |
| LncRNA-AF085935 | 4.12 ± 0.67 | 4.17 ± 0.66 | 1.84 ± 1.11 | < 0.001b, c |
| Variables | r (P-value) | |
|---|---|---|
| HCV-PCR before treatment | HCV-PCR after treatment | |
| IL-10 | 0.02 (0.8) | 0.01 (0.9) |
| IL-17 | 0.05 (0.7) | -0.17 (0.2) |
| LncRNA-AF085935 | -0.033 (0.9) | 0.04 (0.8) |
| Variable | Sensitivity | Specificity | Accuracy | Cut-off point |
|---|---|---|---|---|
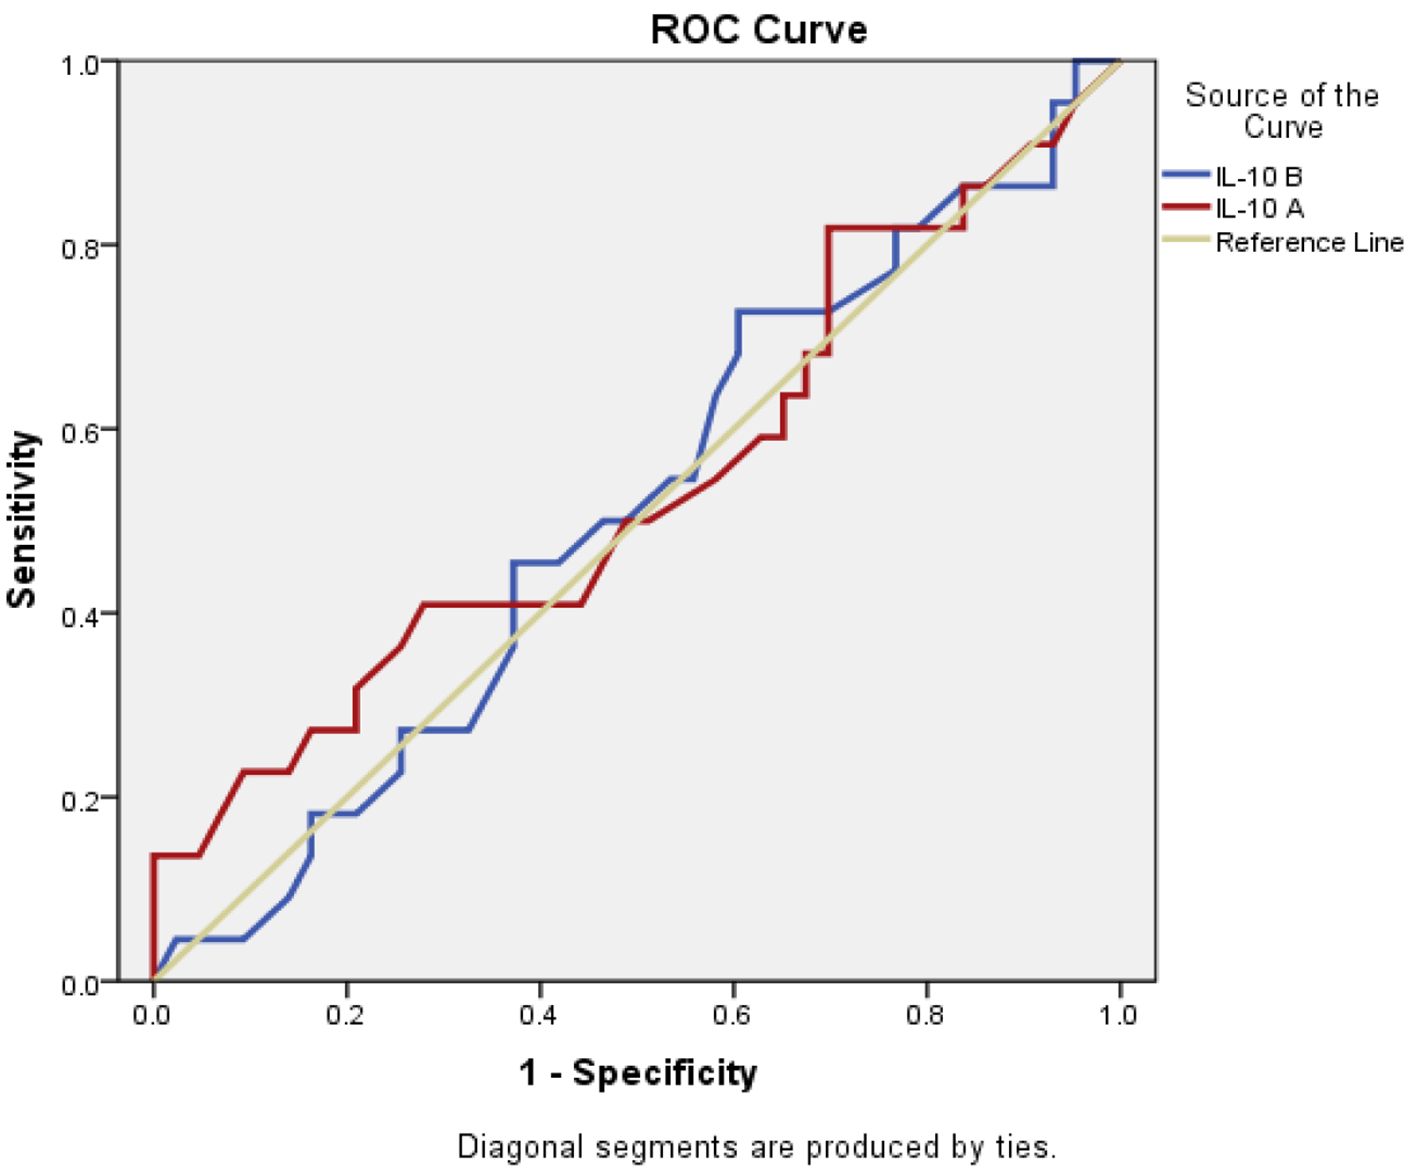
| IL-10 | ||||
| Before | 77.3% | 23.3% | 51% | 45 |
| After | 72.7% | 30.2% | 53.9% | 175.1 |
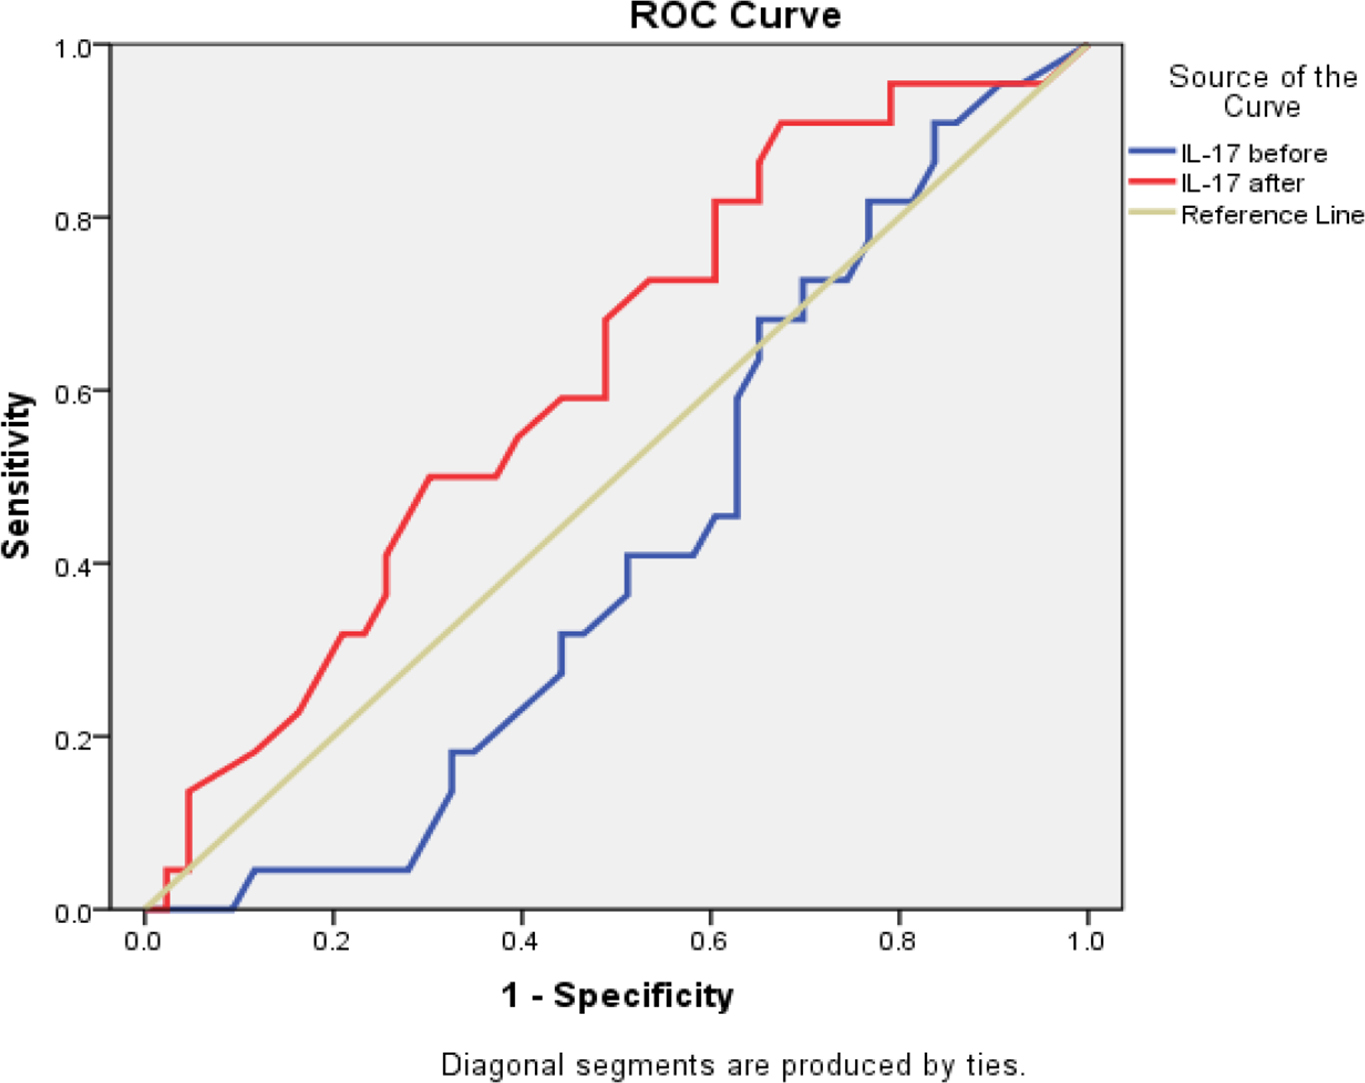
| IL-17 | ||||
| Before | 72.7% | 25.6% | 42% | 198.5 |
| After | 81.8% | 23.3% | 62.1% | 196.8 |
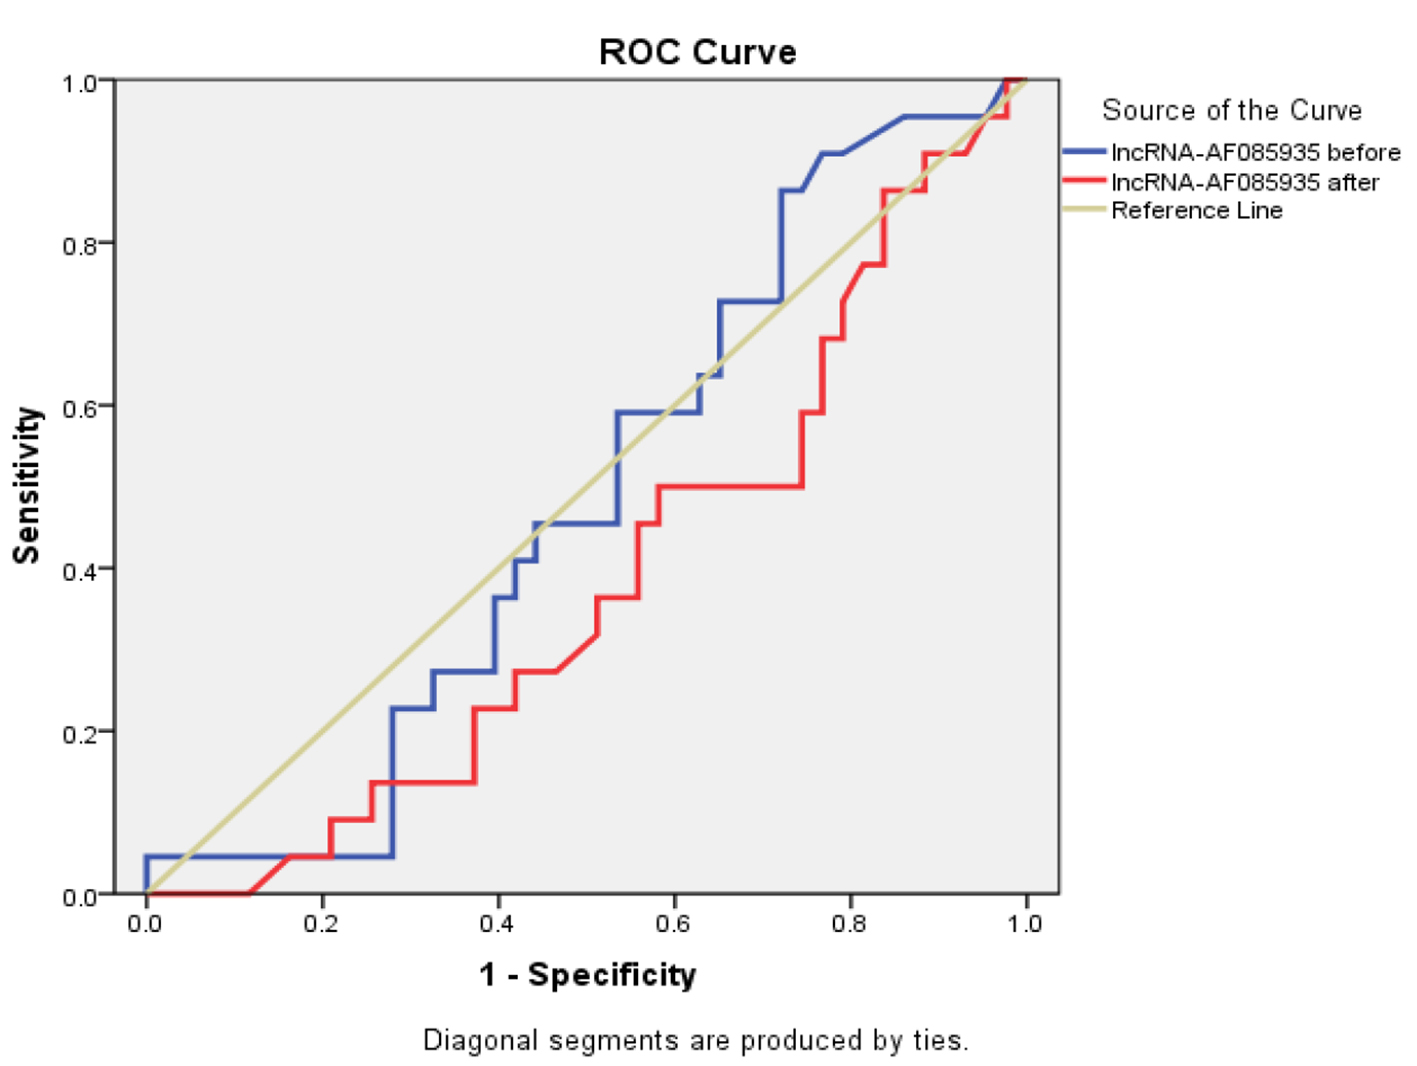
| LncRNA-AF085935 | ||||
| Before | 63.6% | 27.2% | 48.5% | 3.74 |
| After | 68.2% | 20.9% | 38.4% | 3.63 |