Figures
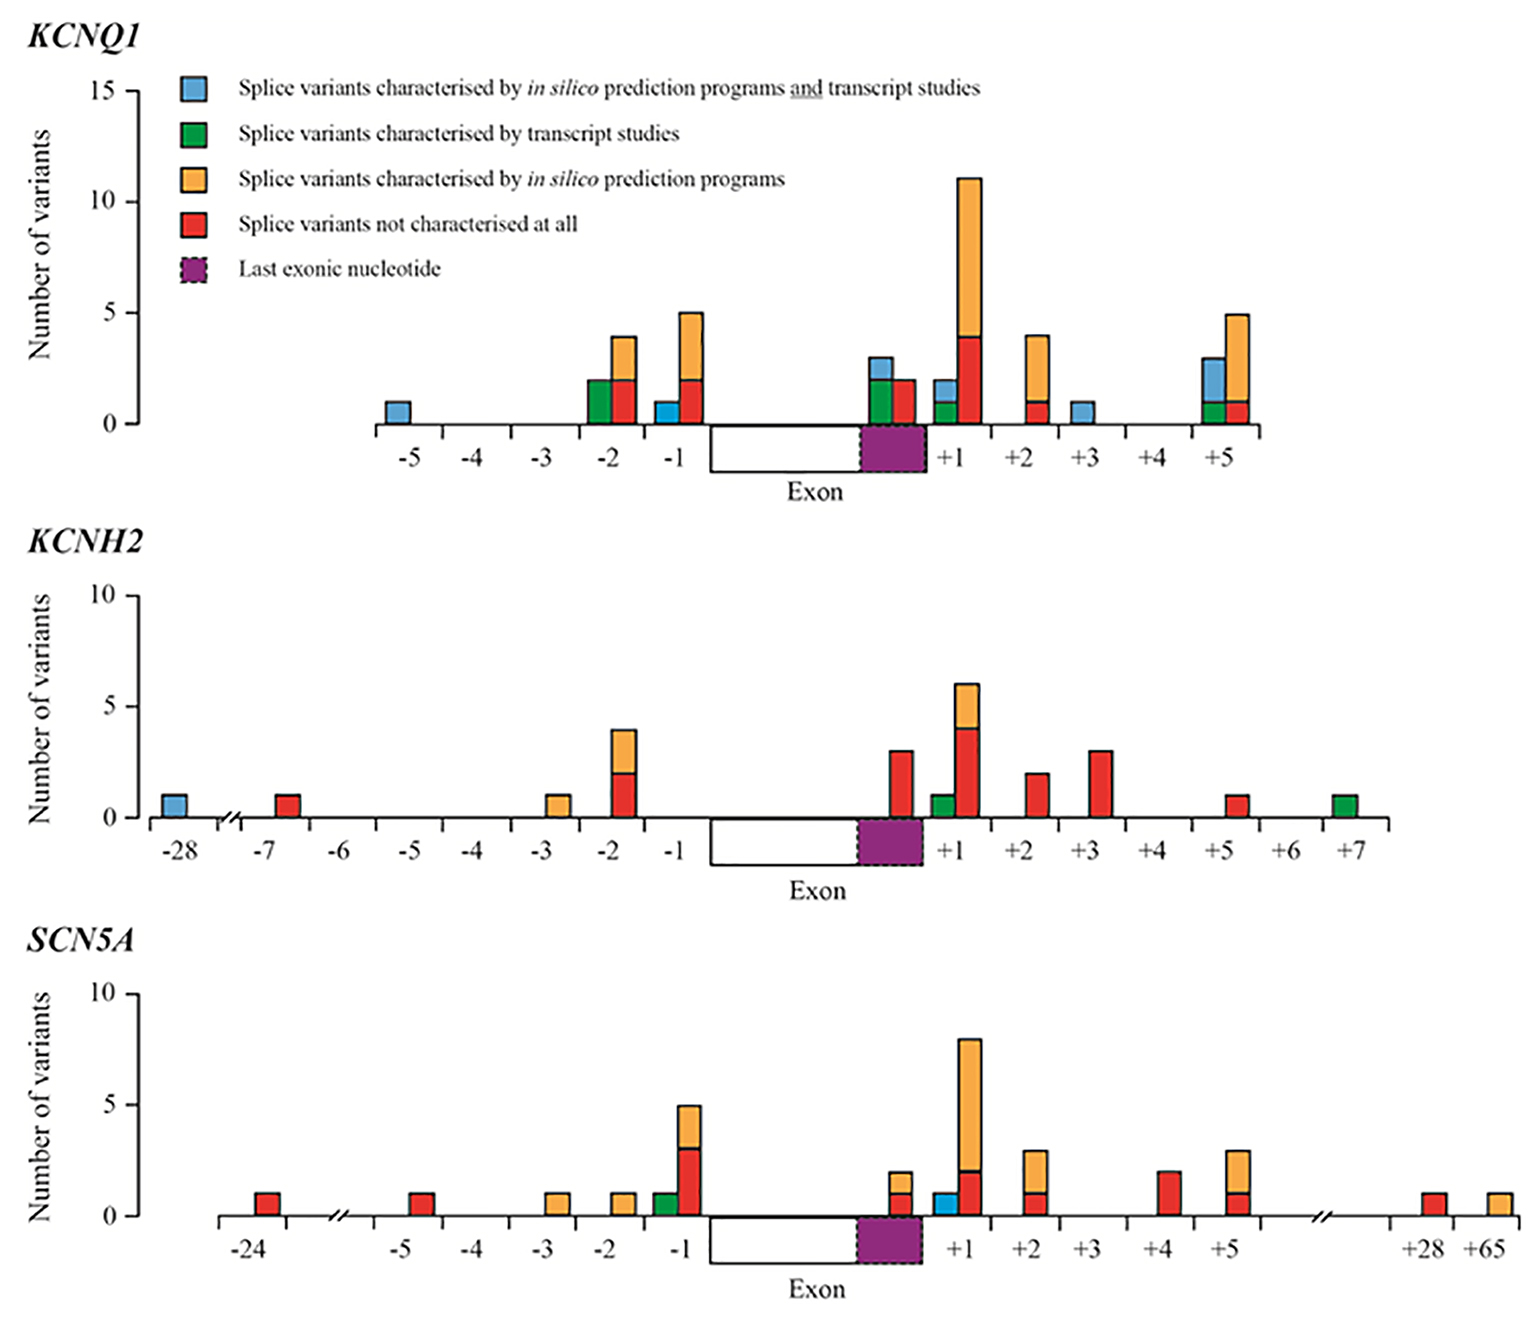
Figure 1. Summary of splice variants reported in HGMD-Pro for the KCNQ1, KCNH2 and SCN5A genes. Blue boxes represent splice variants that have been characterized by in silico prediction studies and transcript studies; green boxes represent splice variants that have been characterized by transcript studies; orange boxes represent variants that have been predicted to have an effect on splicing using in silico prediction programmes (most using one programme described by Xiong et al [11]); red boxes represent splice variants that have not been characterized at all by transcript studies or in silico prediction programmes. Dashed purple boxes represent the last exonic nucleotide.
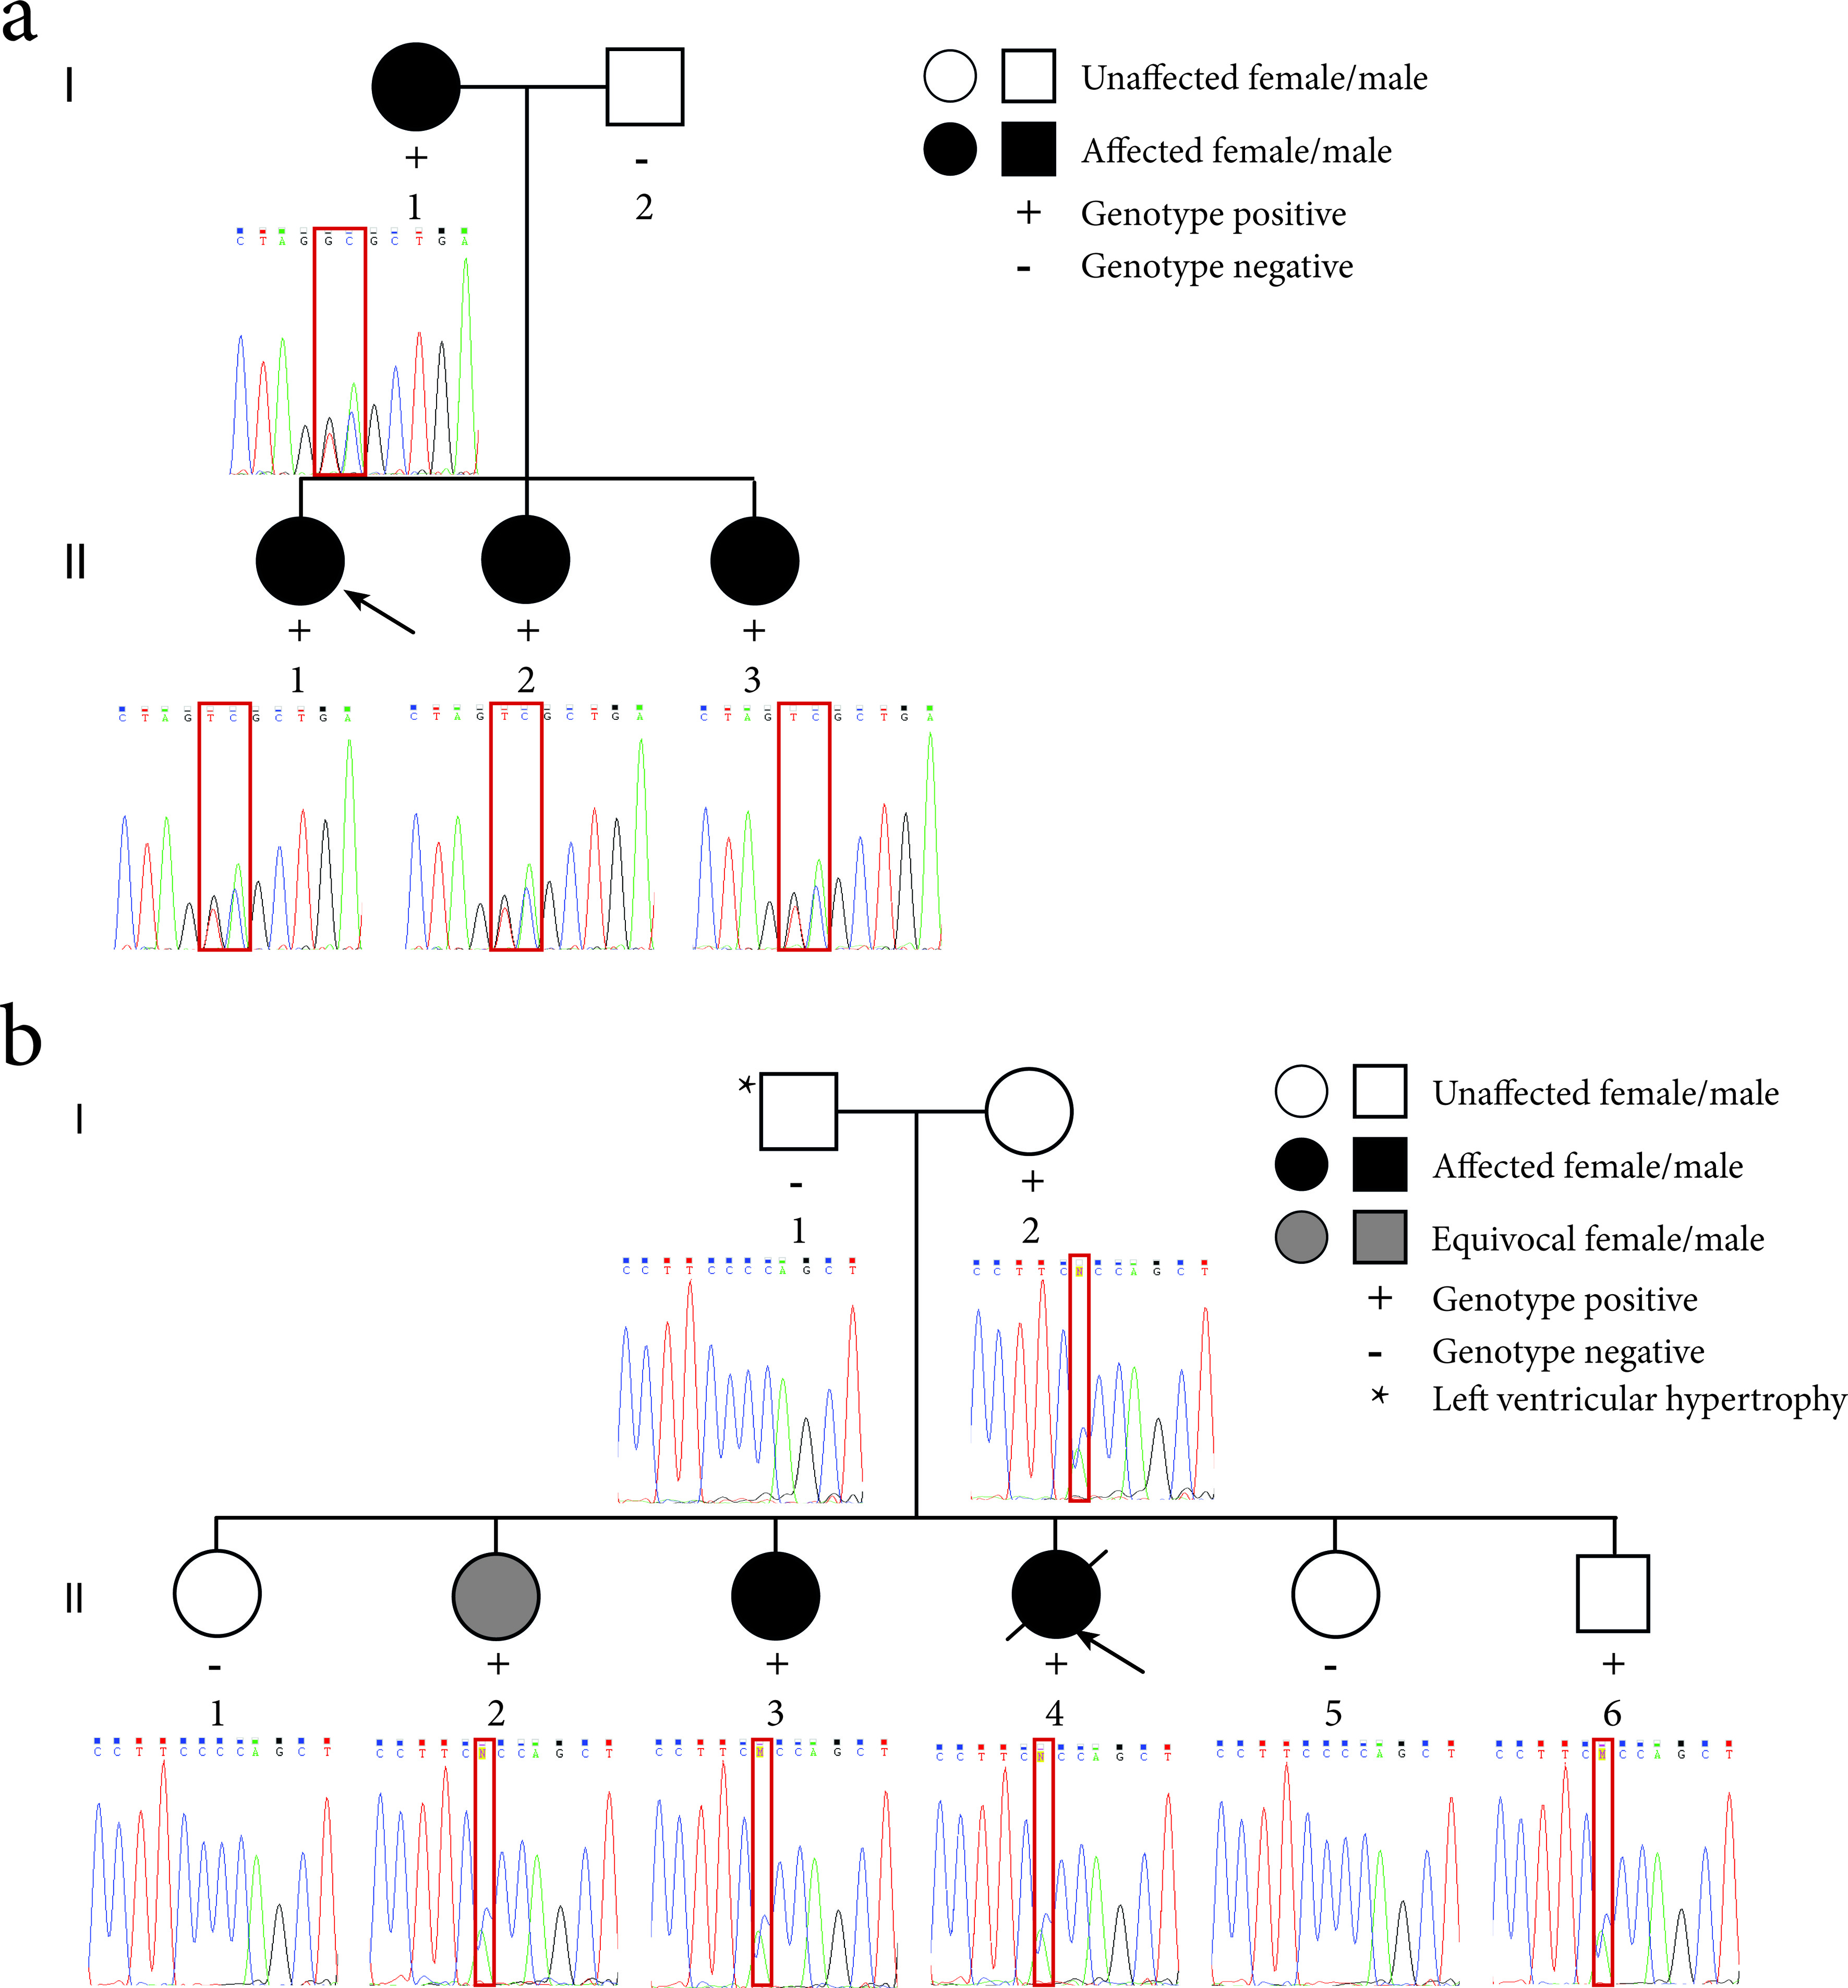
Figure 2. Pedigrees of the LQTS families and sequence electropherograms. (a) Family 1 segregates the c.781_782delinsTC mutation in the KCNQ1 gene. The proband (II-1) is indicated by the black arrow. (b) Family 2 segregates the c.2437-5C>A mutation in the SCN5A gene. The proband (II-4) is indicated by the black arrow. The location of the mutation in the sequence electropherograms is indicated by a red box.
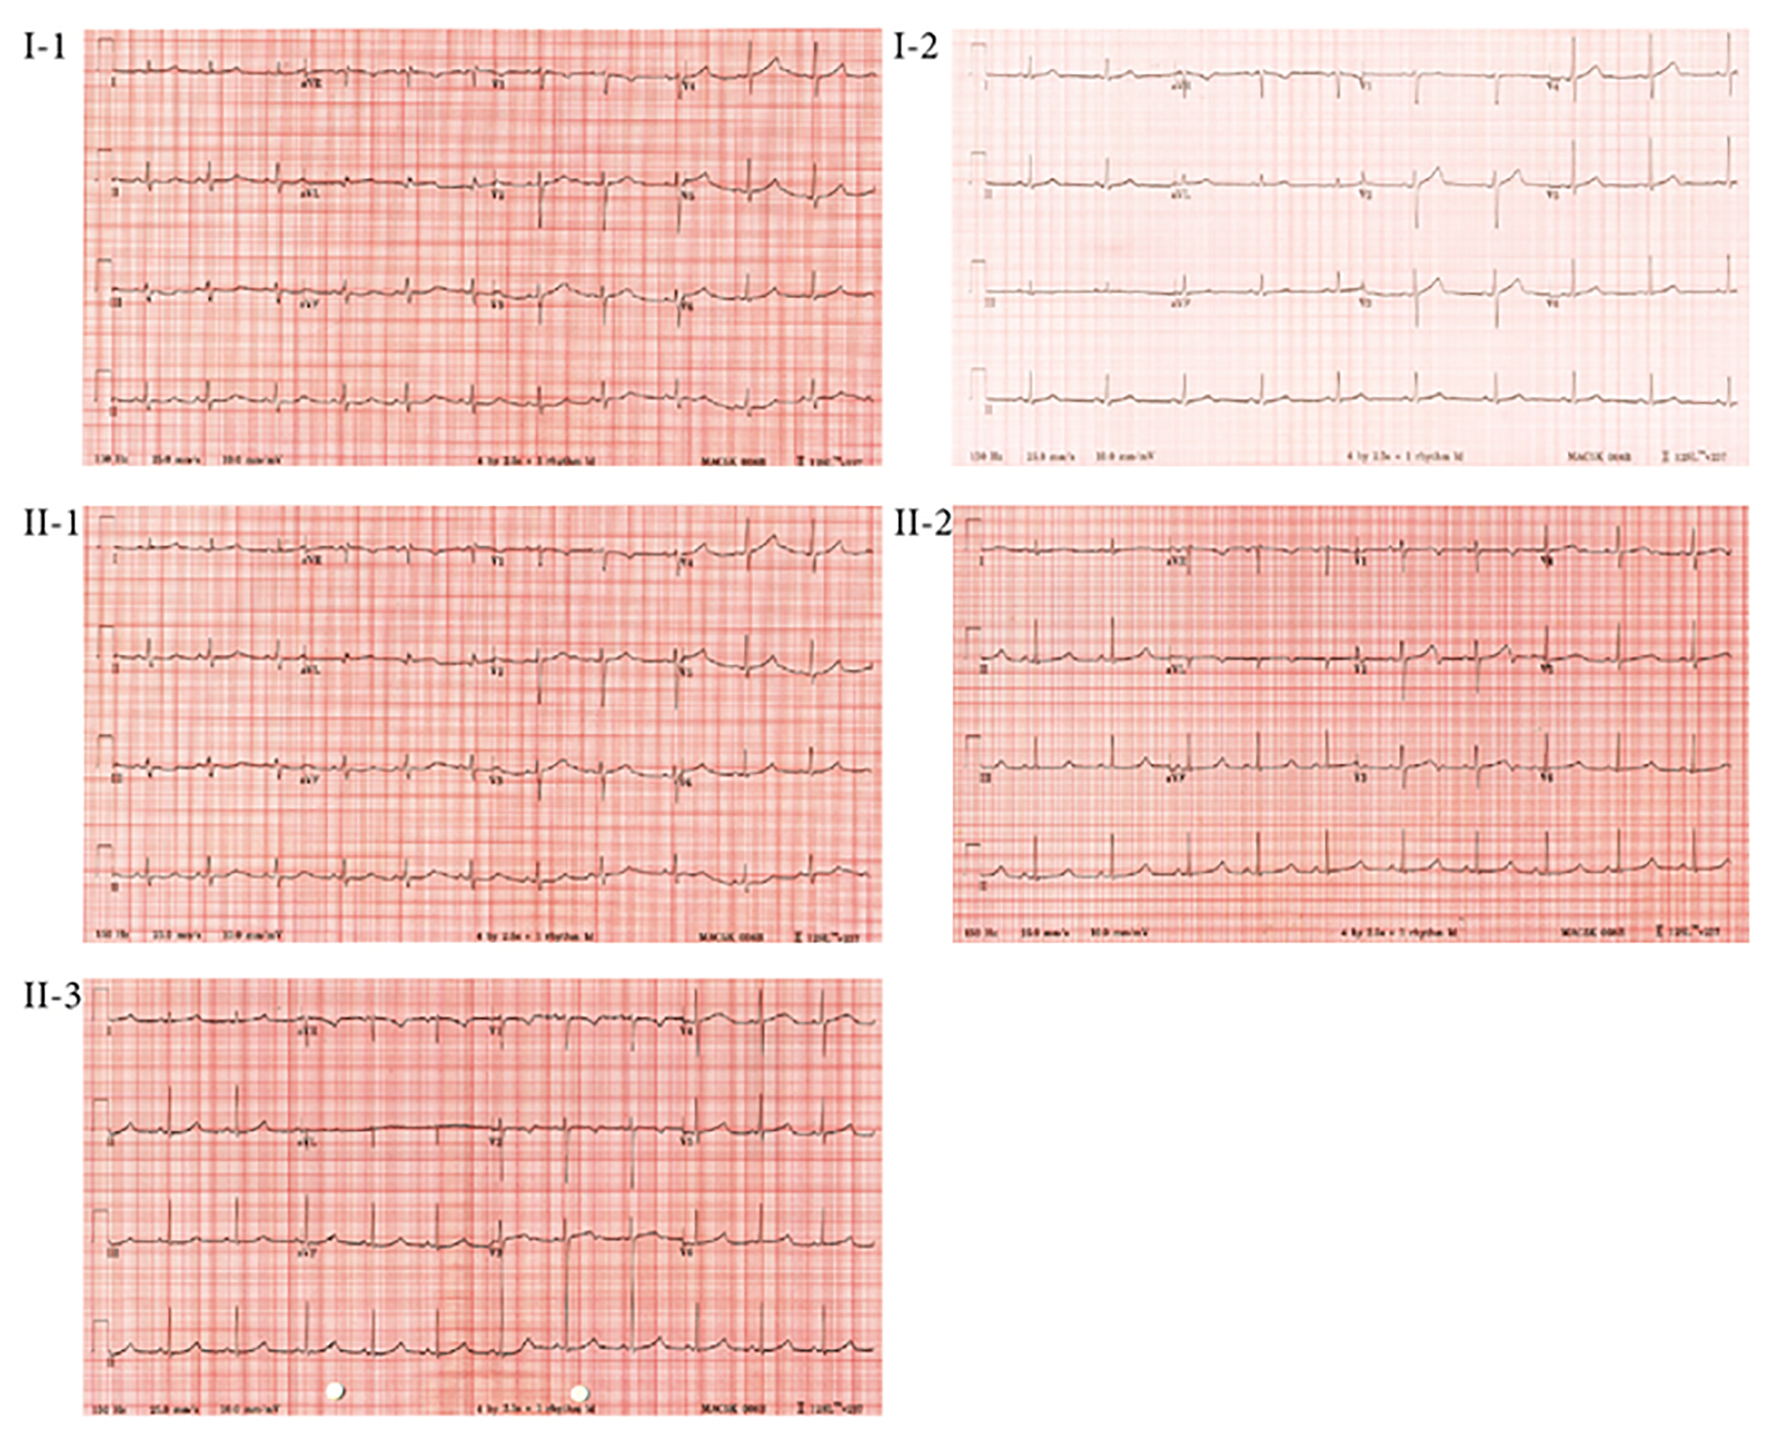
Figure 3. ECG profiles of members of Family 1.
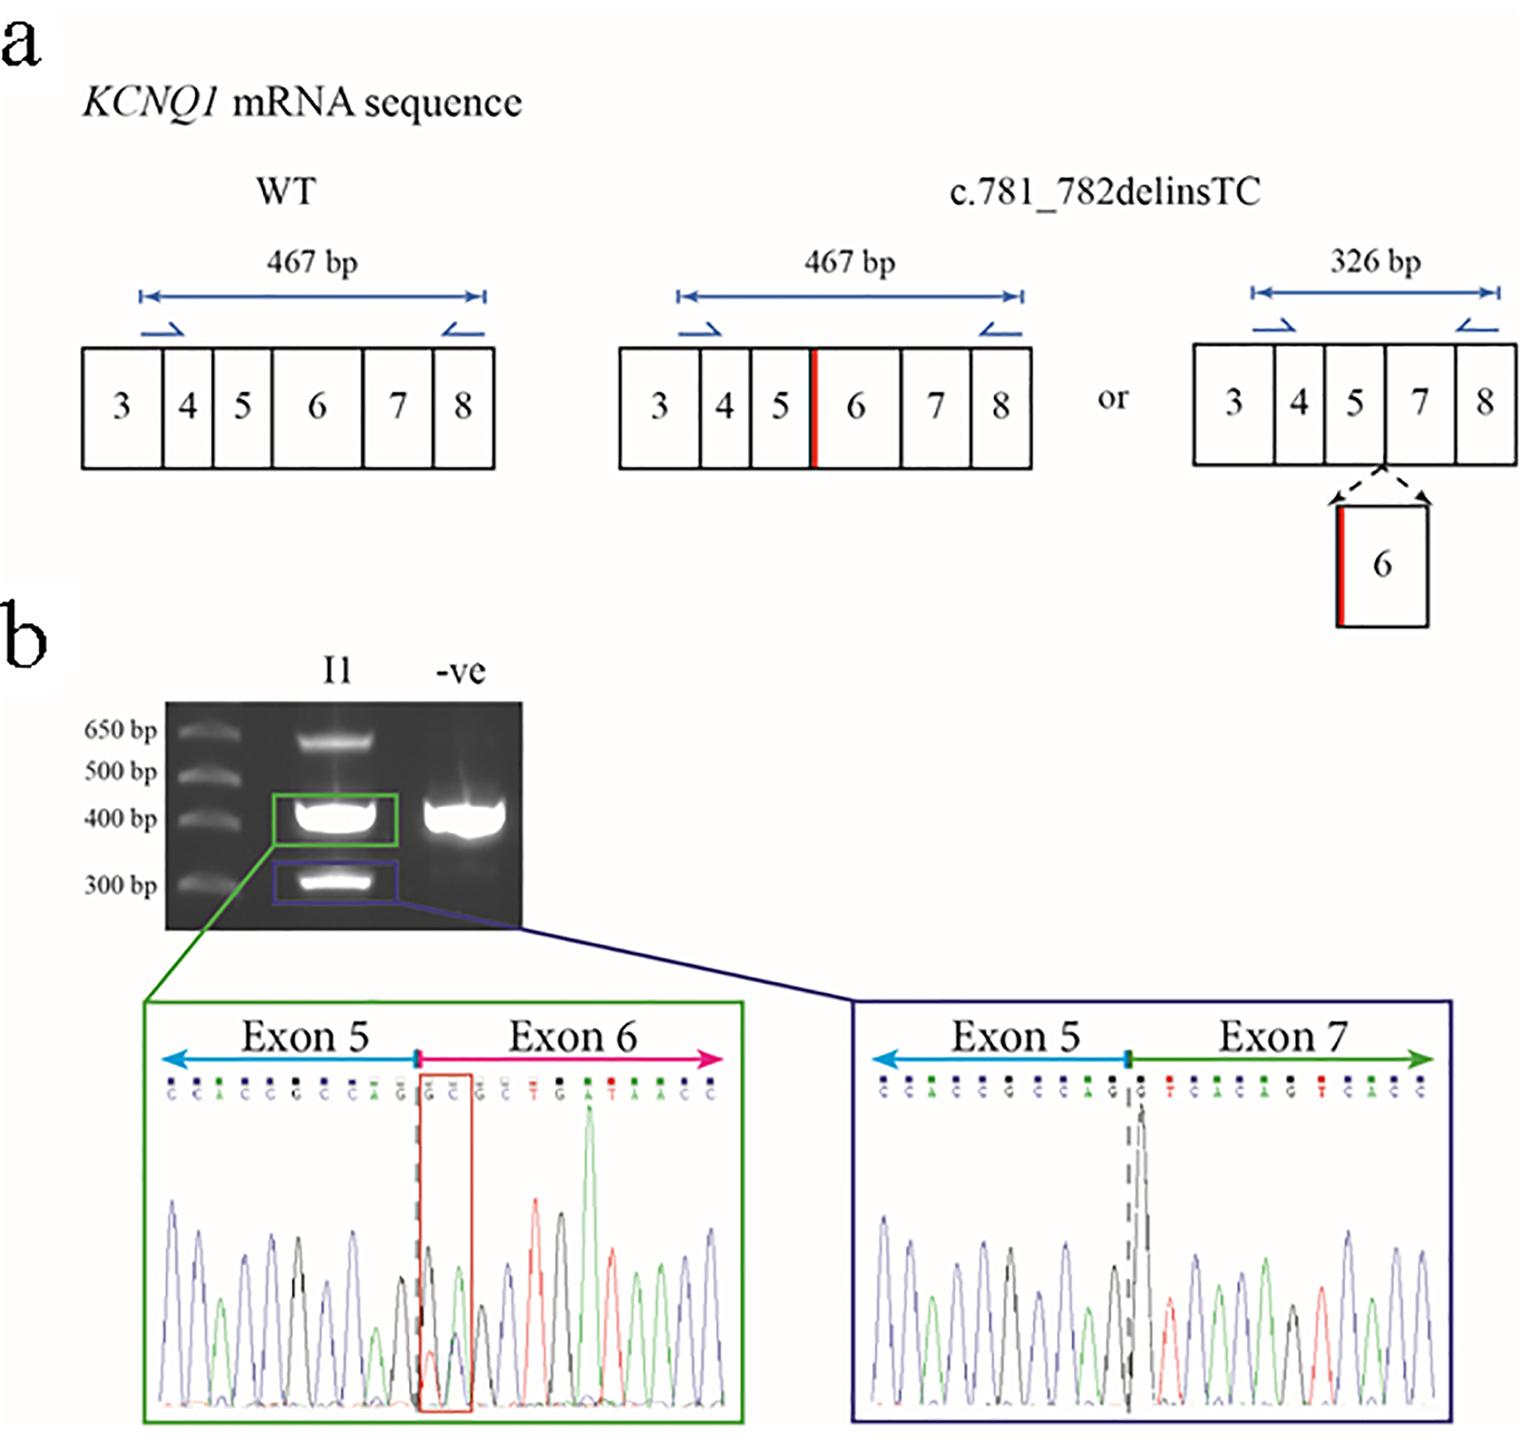
Figure 4. Predicted outcomes for carriers of the c.781_782delinsTC mutation in the KCNQ1 gene, together with transcript analysis. (a) The wild-type (WT) KCNQ1 gene transcript would be unaffected and produce normal KCNQ1, but the mutation could cause an amino acid change at residue 261 of glutamic acid to alanine (p.E261A) or cause exon 6 to be spliced out. Primers for the amplification of cDNA are shown as blue arrows with the lengths of anticipated amplicons shown above the relevant primer pairs. The diagram only shows a partial representation of the KCNQ1 mRNA sequence instead of all 16 exons. The thick red line shows the location of the c.781_782delinsTC mutation in relation to the rest of the exons. (b) The 2% agarose gel showing the results of the PCR amplification of cDNA from the proband’s mother (I-1) and an unrelated control. The highest molecular weight product is a heteroduplex of the two smaller amplicons (representing non-excised and excised exon 6 transcripts). The sequence electropherogram of the about 470 bp amplicon (green box) shows the sequence of the junction between exons 5 and 6 (gray dashed line) and heterozygosity for the c.781_782delinsTC mutation (red box). The approximate 330 bp amplicon (blue box) shows the in-frame fusion of exon 5 and exon 7 (gray dashed line).
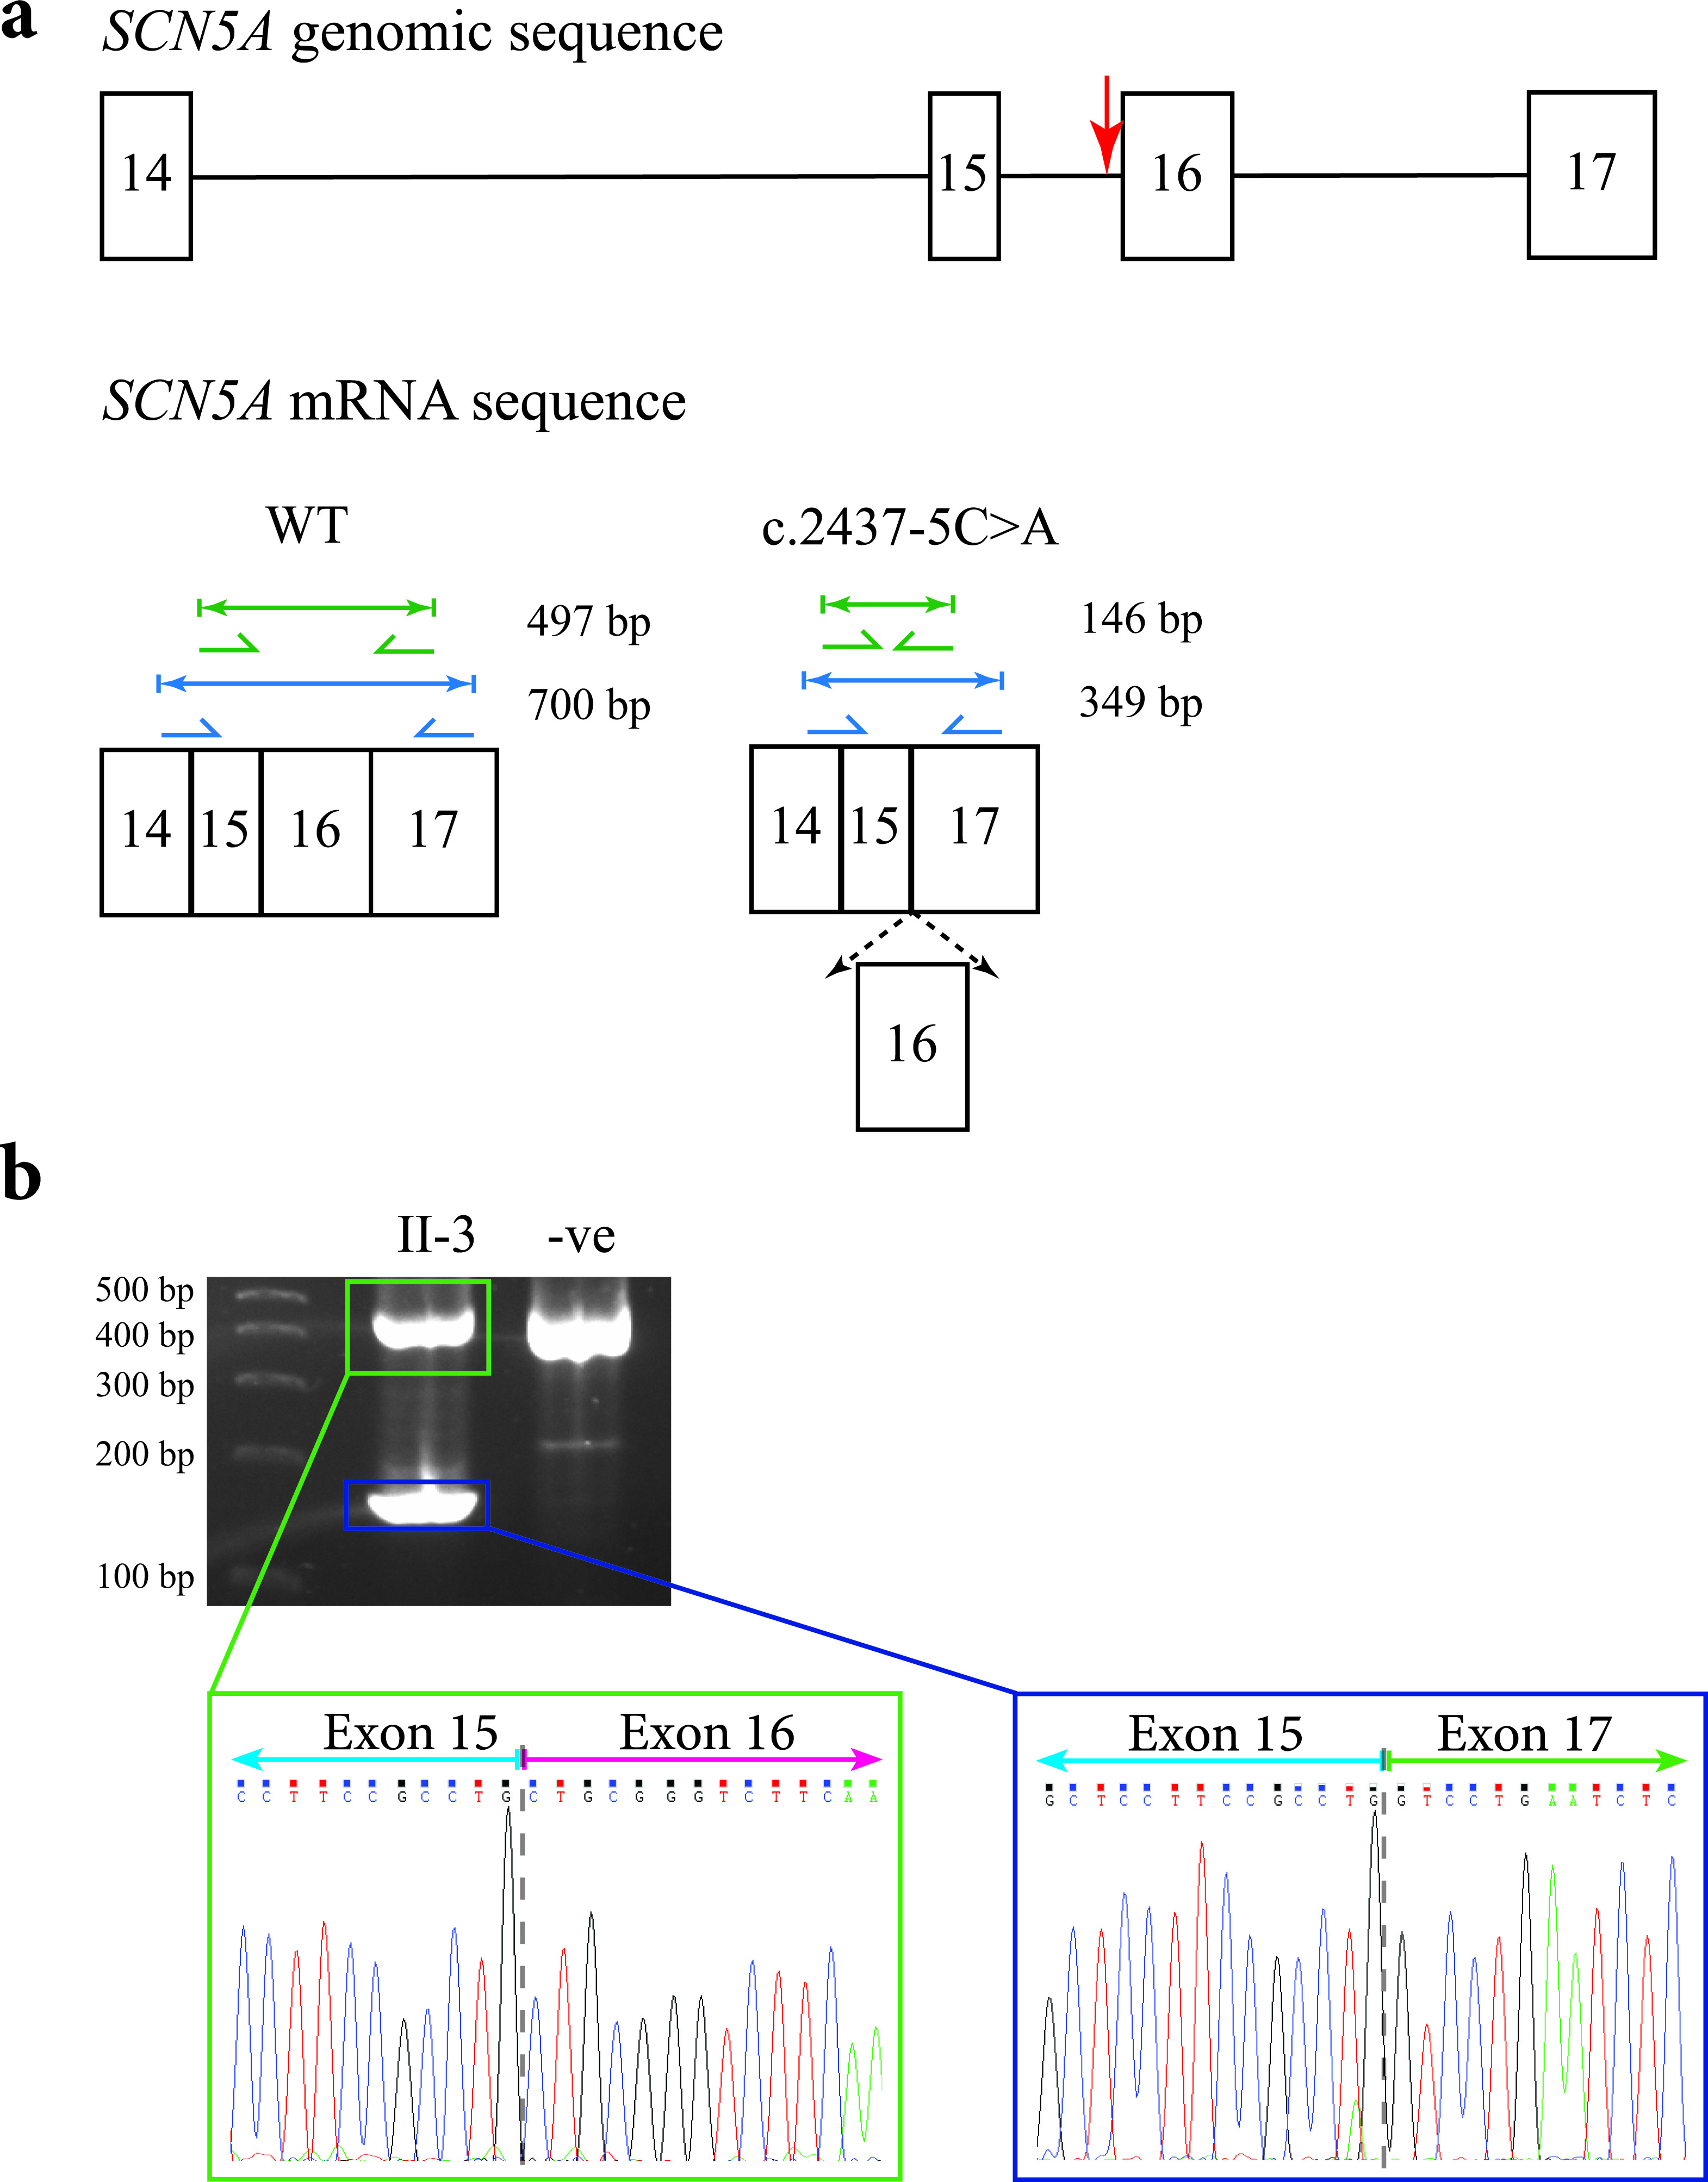
Figure 5. Predicted outcomes for carriers of the c.2437-5C>A mutation in the SCN5A gene, together with transcript analysis. (a) Diagrammatic representation of the genomic location of the c.2437-5C>A mutation in the SCN5A gene in relation to the other exons (indicated by the red arrow; top), and the amplicon sizes of the expected PCR products for an unaffected individual (bottom left), and the shortened amplicon sizes for the carriers of the mutation if exon 16 were spliced out (bottom right). The diagram only shows a partial representation of the SCN5A genomic/mRNA sequence instead of all 16 exons. (b) The 2% agarose gel showing the results of PCR amplification of cDNA from the proband’s sister (II-3) and an unrelated control. The sequence electropherogram of the higher molecular weight amplicon (green box) shows the junction between exons 15 and 16 (gray dashed line). The sequence electropherogram of the lower molecular weight amplicon (blue box) shows the in-frame fusion of exons 15 and 17 (gray dashed line).
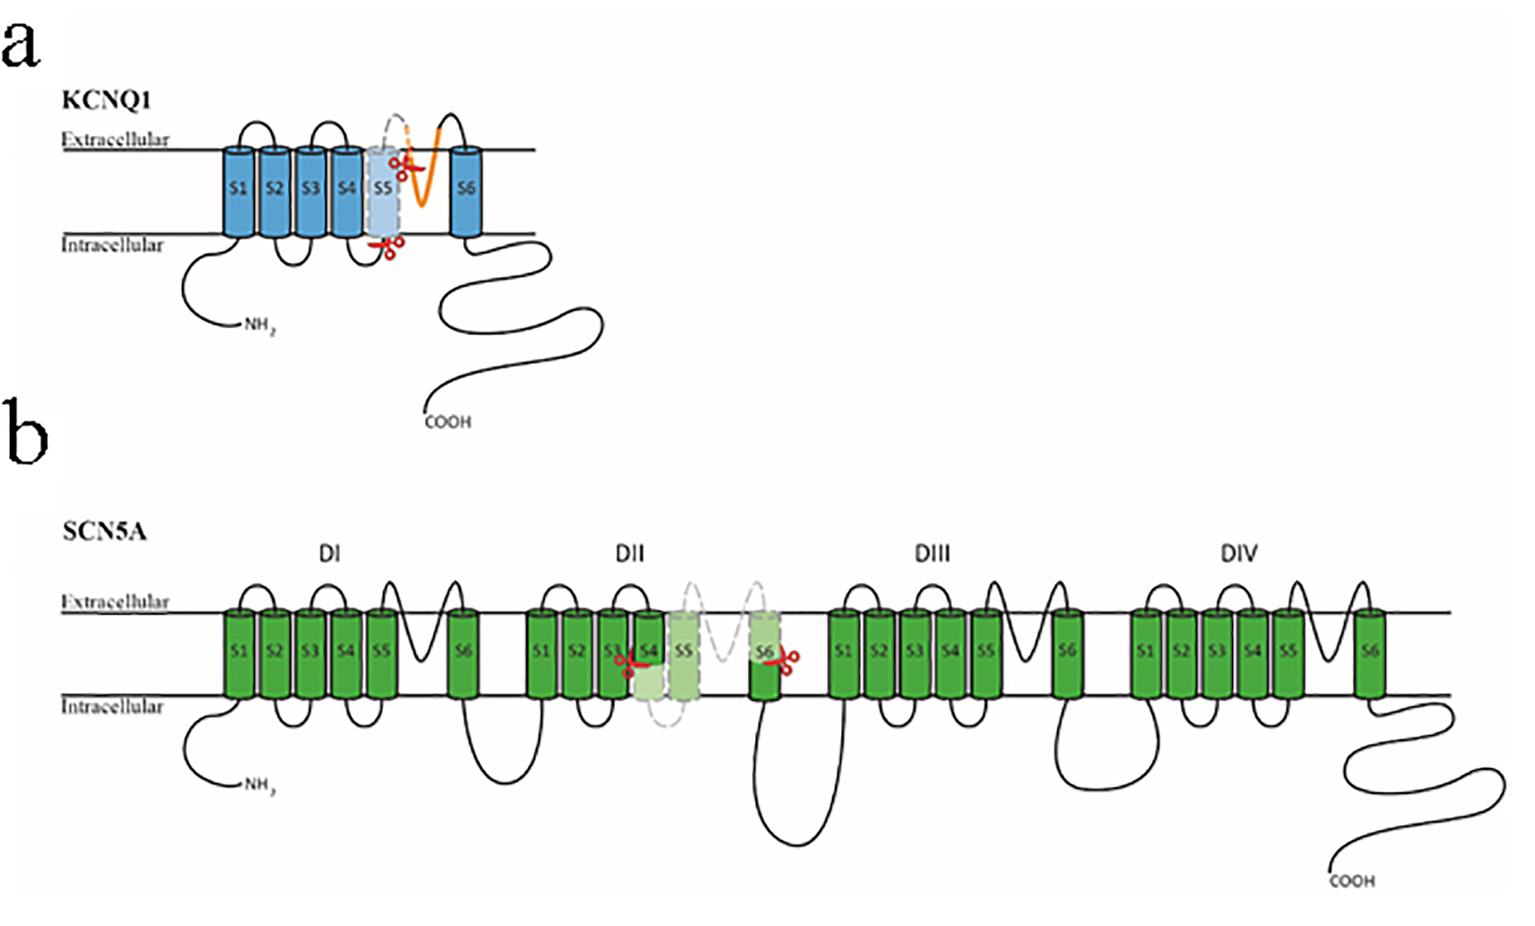
Figure 6. Diagrammatic representation of the KCNQ1 and SCN5A proteins. (a) The KCNQ1 protein is composed of six transmembrane domains (S1-S6) with a pore region between S5 and S6 (shown in orange). The section encompassed by the two red scissors and colored in light blue is encoded by exon 6 of the KCNQ1 gene. (b) The SCN5A protein is composed of four homologous transmembrane domains (DI-DIV) with six transmembrane segments (S1-S6) in each section. The four sections’ S1-S4 domains form the channel’s voltage-sensing region, and the four S5-S6 domains with the intervening loop region form the central pore region and selective filter. The section encompassed by the two red scissors and colored in light green is encoded by exon 16 of the SCN5A gene.
Tables
Table 1. Breakdown of Mutation Types Reported in the KCNQ1, KCNH2 and SCN5A Genes
| Disorder | Gene | Missense | Non-sense | Small deletions | Small insertion/duplications | Splicing |
|---|
| Frameshift | In-frame | Frameshift | In-frame |
|---|
| LQT: long QT syndrome; SD: sudden death; BrS: Brugada syndrome. |
| LQT | KCNQ1 | 324 | 26 | 39 | 18 | 21 | 6 | 44 |
| KCNH2 | 471 | 55 | 112 | 11 | 58 | 8 | 24 |
| SCN5A | 205 | 5 | 1 | 8 | 1 | 2 | 7 |
| SD | KCNQ1 | 12 | | | | | | |
| KCNH2 | 13 | 1 | | | | | |
| SCN5A | 36 | 1 | 1 | | | | |
| BrS | KCNQ1 | NA | NA | NA | NA | NA | NA | NA |
| KCNH2 | 3 | | | | | | |
| SCN5A | 265 | 35 | 44 | 6 | 15 | 4 | 20 |
Table 2. Breakdown of All the Splicing Mutations Reported in the KCNQ1, KCNH2 and SCN5A Genes
| Gene | # splicing variants | # variants with segregation studies | # variants with prediction results | # variants with transcript studies | Transcript studies results |
|---|
| Exon skipping | Cryptic splice site triggered |
|---|
| Frameshift | In-frame | Frameshift | In-frame |
|---|
| †One or more variants in the category cause multiple exon-skipping/cryptic splice site activation events. |
| KCNQ1 | 44 | 19 | 26 | 13 | 4 | 8† | 3† | |
| KCNH2 | 24 | 6 | 6 | 3 | | 2 | 3† | |
| SCN5A | 27 | 6 | 17 | 2 | 1† | | 4† | |
Table 3. Sequences of Primers for the Analysis of Gene Transcripts in Families 1 and 2
| Forward primer | Reverse primer |
|---|
| If amplicons needed to be sequenced, then forward and reverse primers for relevant amplicons were 5′- tailed with the M13 sequences 5′-TGTAAAACGACGGCCAGT-3′ and 5′-CAGGAAACAGCTATGACC-3′, respectively. Primers corresponding to the M13 tails were used for the sequencing reactions. |
| Family 1 | | GCCCATTTCCATCATCGACC | CAAACCCCGAGCCAAGAATC |
| Family 2 | Outer primer | GGAAACCTGGTCTTCACAGG | GGAGACCACAGCAGAAATCC |
| Inner primer | CTGGAACATCTTCGACAGCA | TGTCTGCACTGAAGGAGCTG |


