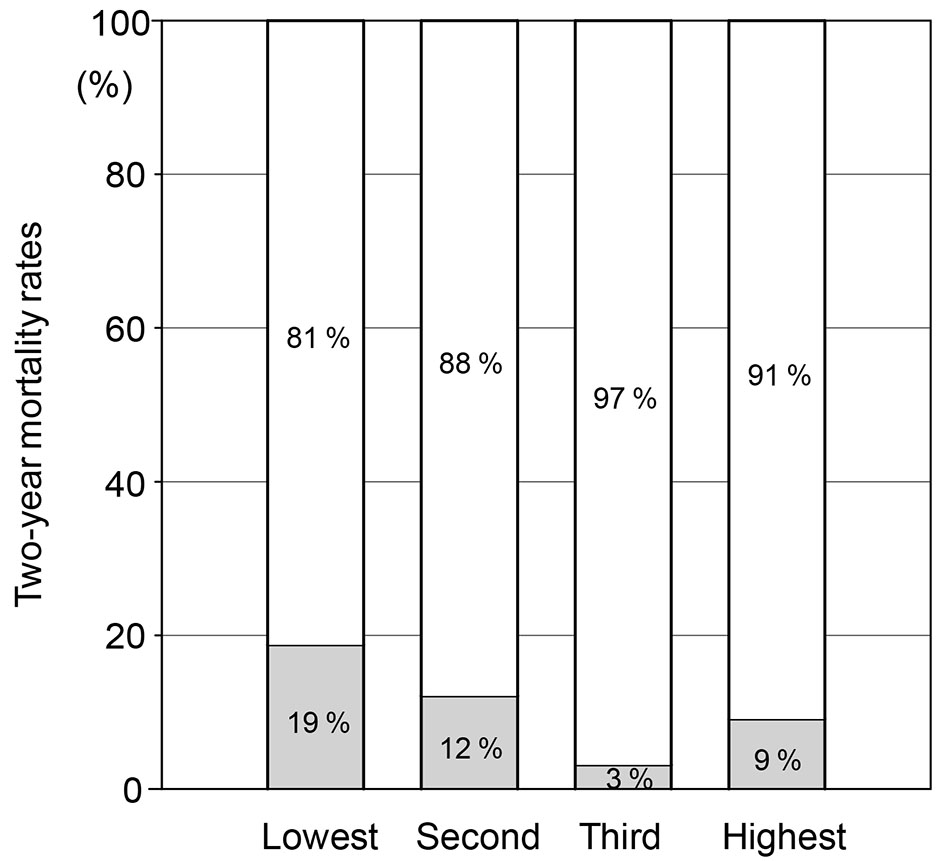
Figure 1. Mortality rates in quartiles (lowest, second, third and highest) according to ΔBWI.
| Journal of Clinical Medicine Research, ISSN 1918-3003 print, 1918-3011 online, Open Access |
| Article copyright, the authors; Journal compilation copyright, J Clin Med Res and Elmer Press Inc |
| Journal website http://www.jocmr.org |
Original Article
Volume 9, Number 3, March 2017, pages 200-206
The Change in Body Weight During Hospitalization Predicts Mortality in Patients With Acute Decompensated Heart Failure
Figures
Tables
| Survival group (n = 116) | Death group (n = 14) | Survival vs. death P value | |
|---|---|---|---|
| DM: diabetes mellitus; HTN: hypertension; SBP: systolic blood pressure; NYHA: New York Heart Association; HF: heart failure; IHD: ischemic heart disease; HTCM: hypertensive cardiomyopathy; DCM: dilated cardiomyopathy; ICD: implantable cardioverter defibrillator; LVEF: left ventricular ejection fraction; ACEI: angiotensin converting enzyme inhibitors; ARB: angiotensin II type 1 receptor blocker; BNP: brain natriuretic peptide; Na: sodium; BUN: blood urea nitrogen; Hb: hemoglobin; CCr: creatinine clearance; SFA: surface area; BW: body weight; BMI: body mass index; ΔBWI: changes in body weight index; Q: quartile. | |||
| Age, years | 67 ± 10 | 81 ± 5 | 0.0007 |
| Male, n (%) | 72 (62) | 7 (50) | 0.38 |
| DM, n (%) | 26 (22) | 8 (43) | 0.09 |
| HTN, n (%) | 69 (59) | 7 (50) | 0.53 |
| SBP, mm Hg | 127 ± 19 | 119 ± 18 | 0.03 |
| NYHA functional class | |||
| II, n (%) | 23 (19) | 2 (14) | 0.61 |
| III, n (%) | 25 (22) | 6 (42) | 0.08 |
| IV, n (%) | 65 (56) | 6 (42) | 0.34 |
| The cause of HF | |||
| IHD, n (%) | 34 (29) | 3 (21) | 0.53 |
| HTCM, n (%) | 11 (9) | 1 (7) | 0.77 |
| Valvular disease, n (%) | 22 (18) | 3 (21) | 0.82 |
| DCM, n (%) | 21 (18) | 5 (35) | 0.11 |
| Arrythmia, n (%) | 13 (11) | 1 (7) | 0.64 |
| Unknown, n (%) | 15 (12) | 1 (7) | 0.53 |
| ICD, n (%) | 16 (13) | 6 (42) | 0.006 |
| LVEF, % | 43 ± 18 | 39 ± 16 | 0.38 |
| Medications | |||
| Diuretics, n (%) | 92 (79) | 13 (92) | 0.22 |
| ACEI/ARB, n (%) | 87 (75) | 8 (57) | 0.15 |
| Digitalis, n (%) | 11 (9) | 2 (14) | 0.57 |
| Oral anticoagulant, n (%) | 56 (48) | 7 (50) | 0.90 |
| Nitrates, n (%) | 11 (9) | 2 (14) | 0.57 |
| Spironolactone, n (%) | 68 (58) | 9 (64) | 0.68 |
| β-blockers, n (%) | 70 (60) | 8 (57) | 0.81 |
| Antiplatelets, n (%) | 61 (52) | 5 (35) | 0.23 |
| Laboratory test | |||
| BNP, pg/mL | 370.0 ± 274.2 | 842.5 ± 292.5 | 0.006 |
| Na, mEq/L | 141.0 ± 2.0 | 137.0 ± 2.0 | 0.001 |
| BUN, mg/dL | 18.0 ± 4.0 | 37.5 ± 12.5 | 0.00003 |
| Hb, g/dL | 13.5 ± 2.5 | 11.6 ± 1.4 | 0.008 |
| CCr, ml/min | 54.9 ± 17.4 | 26.5 ± 7.1 | 0.00002 |
| Duration of hospitalization, days | 21.0 ± 8.5 | 36.0 ± 16.5 | 0.01 |
| SFA at discharge, m2 | 1.57 ± 0.19 | 1.48 ± 0.22 | 0.12 |
| BW at hospitalization, kg | 61.0 ± 8.9 | 52.5 ± 12.6 | 0.13 |
| BW at discharge, kg | 54.9 ± 8.3 | 48.3 ± 8.6 | 0.19 |
| BMI at admission, kg/m2 | 23.9 ± 2.4 | 23.2 ± 3.2 | 0.59 |
| BMI at discharge, kg/m2 | 21.8 ± 2.2 | 21.1 ± 1.8 | 0.89 |
| ΔBWI, kg/m2 | 3.18 ± 1.69 | 2.14 ± 1.42 | 0.13 |
| Lowest Q, n (%) | 26 (22) | 6 (42) | 0.09 |
| Second Q, n (%) | 29 (25) | 4 (28) | 0.77 |
| Third Q, n (%) | 31 (26) | 1 (7) | 0.10 |
| Highest Q, n (%) | 30 (25) | 3 (21) | 0.71 |
| Lowest Q (n = 32) | Second Q (n = 33) | Third Q (n = 32) | Highest Q (n = 33) | P value | |
|---|---|---|---|---|---|
| ΔBWI: changes in body weight index; Q: quartile; DM: diabetes mellitus; HYN; hypertension; SBP: systolic blood pressure; NYHA: New York Heart Association; HF; heart failure; IHD: ischemic heart disease; HTCM: hypertensive cardiomyopathy; DCM: dilated cardiomyopathy; ICD: implantable cardioverter defibrillator; LVEF: left ventricular ejection fraction; ACEI: angiotensin converting enzyme inhibitors; ARB: angiotensin II type 1 receptor blocker; BNP: brain natriuretic peptide; Na: sodium; BUN: blood urea nitrogen; Hb: hemoglobin; BW: body weight; BMI: body mass index; CCr: creatinine clearance; SFA: surface area. | |||||
| Age, years | 74 ± 9 | 65 ± 11 | 68 ± 7 | 63 ± 10 | 0.008 |
| Male, n (%) | 15 (47) | 16 (49) | 22 (69) | 26 (79) | 0.02 |
| DM | 8 (25) | 13 (39) | 5 (15) | 6 (18) | 0.11 |
| HTN | 24 (75) | 19 (57) | 17 (53) | 15 (45) | 0.10 |
| SBP, mm Hg | 124.5 ± 10.0 | 122.0 ± 22.9 | 130.0 ± 15.0 | 124.0 ± 28.5 | 0.83 |
| NYHA functional class | |||||
| II, n (%) | 9 (28) | 8 (24) | 7 (21) | 1 (3) | 0.048 |
| III, n (%) | 13 (40) | 7 (21) | 7 (21) | 4 (12) | 0.05 |
| IV, n (%) | 9 (28) | 18 (54) | 16 (50) | 28 (84) | <0.0001 |
| The cause of HF | |||||
| IHD, n (%) | 7 (21) | 7 (21) | 9 (28) | 14 (42) | 0.19 |
| HTCM, n (%) | 3 (9) | 2 (6) | 3 (9) | 4 (12) | 0.86 |
| Valvular disease, n (%) | 9 (28) | 7 (21) | 7 (21) | 2 (6) | 0.13 |
| DCM, n (%) | 4 (12) | 8 (24) | 6 (18) | 8 (24) | 0.59 |
| Arrythmia, n (%) | 6 (18) | 4 (12) | 2 (6) | 2 (6) | 0.30 |
| Unknown, n (%) | 3 (9) | 5 (15) | 5 (15) | 3 (9) | 0.77 |
| ICD, n (%) | 3 (9) | 8 (24) | 5 (15) | 6 (18) | 0.45 |
| LVEF, % | 51 ± 18 | 42 ± 17 | 42 ± 19 | 36 ± 13 | 0.01 |
| Medications | |||||
| Diuretics, n (%) | 24 (75) | 26 (78) | 26 (81) | 29 (87) | 0.60 |
| ACEI/ARB, n (%) | 25 (78) | 24 (72) | 27 (84) | 19 (57) | 0.09 |
| Digitalis, n (%) | 0 (0) | 5 (15) | 2 (6) | 6 (18) | 0.06 |
| Oral anticoagulant, n (%) | 15 (46) | 17 (51) | 17 (53) | 14 (42) | 0.82 |
| Nitrates, n (%) | 4 (12) | 4 (12) | 4 (12) | 1 (3) | 0.49 |
| Spironolactone, n (%) | 15 (46) | 22 (66) | 21 (65) | 19 (57) | 0.33 |
| β-blockers, n (%) | 23 (71) | 14 (42) | 22 (68) | 19 (57) | 0.06 |
| Antiplatelets, n (%) | 17 (53) | 15 (45) | 14 (43) | 20 (60) | 0.50 |
| Laboratory test | |||||
| BNP, pg/mL | 262.5 ± 267.7 | 473.0 ± 333.3 | 370.0 ± 190.2 | 588.0 ± 533.2 | 0.10 |
| Na, mEq/L | 140.0 ± 2.0 | 141.0 ± 2.6 | 140.0 ± 2.0 | 141.0 ± 1.5 | 0.17 |
| BUN, mg/dL | 19.5 ± 4.3 | 19.0 ± 6.0 | 17.0 ± 4.8 | 19.0 ± 5.1 | 0.88 |
| Hb, g/dL | 12.5 ± 2.4 | 13.5 ± 2.4 | 13.1 ± 2.8 | 14.0 ± 2.2 | 0.08 |
| BW at admission, kg | 55.3 ± 8.3 | 58.7 ± 9.8 | 58.5 ± 8.6 | 65.0 ± 8.5 | 0.03 |
| BW at discharge, kg | 54.6 ± 8.7 | 55.9 ± 9.5 | 53.3 ± 8.3 | 53.4 ± 7.2 | 0.78 |
| BMI at admission, kg/m2 | 22.8 ± 2.5 | 24.3 ± 2.6 | 24.0 ± 2.3 | 24.9 ± 2.1 | 0.14 |
| BMI at discharge, kg/m2 | 22.5 ± 2.4 | 22.6 ± 2.4 | 21.4 ± 2.3 | 20.8 ± 2.0 | 0.07 |
| Duration of hospitalization, days | 18.5 ± 7.0 | 20.0 ± 8.3 | 23.5 ± 9.8 | 28.0 ± 11.8 | 0.006 |
| CCr, mL/min | 46.4 ± 18.5 | 63.0 ± 21.0 | 53.5 ± 19.6 | 52.9 ± 15.5 | 0.09 |
| SFA at discharge, m2 | 1.52 ± 0.21 | 1.59 ± 0.20 | 1.54 ± 0.17 | 1.58 ± 0.19 | 0.45 |
| Two-year mortality rates, n (%) | 6 (18) | 4 (12) | 1 (3) | 3 (9) | 0.23 |
| β | z value | P value | |
|---|---|---|---|
| DM: diabetes mellitus; CCr: creatinine clearance; ΔBWI: changes in body weight index; HTCM: hypertensive cardiomyopathy; BNP: brain natriuretic peptide; SBP: systolic blood pressure. | |||
| DM | 2.51 | 3.05 | 0.0023 |
| Duration of hospitalization | 0.99 | 3.38 | 0.0007 |
| CCr | -1.01 | 3.7 | 0.0002 |
| ΔBWI | -3.53 | 3.72 | 0.0002 |
| β-blockers | -3.66 | 2.97 | 0.0029 |
| HTCM | 5.53 | 3.06 | 0.0022 |
| BNP | 0.52 | 3.44 | 0.0006 |
| SBP | -1.29 | 3.67 | 0.0002 |
| β | z value | P value | RR (95% CI) | |
|---|---|---|---|---|
| ΔBWI: changes in body weight index; Q: quartile; RR: relative risk; CI: confidence interval | ||||
| ΔBWI | ||||
| Lowest Q | 2 | 1.99 | 0.04 | 7.46 (1.03 - 53.99) |
| Second Q | 1.39 | 1.6 | 0.1 | 4.02 (0.73 - 22.04) |
| Third Q | -0.1 | 0.08 | 0.93 | 0.89 (0.07 - 11.16) |
| Highest Q | 1.00 | |||