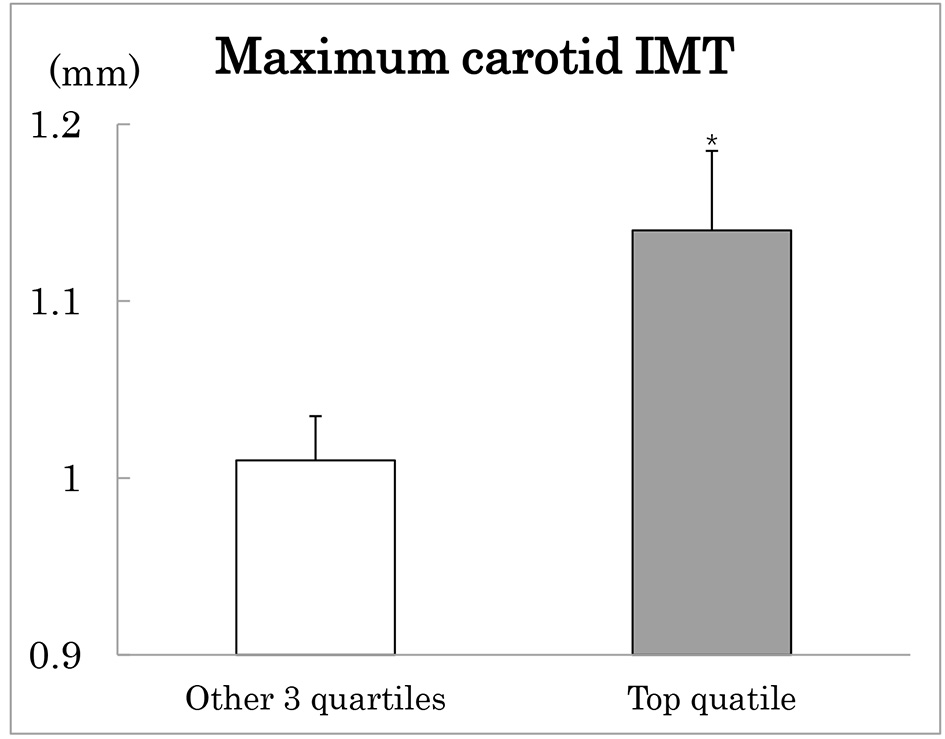
Figure 1. Maximum carotid intima-media thickness (IMT) in type 2 diabetes patients with the highest (black column) compared to the other three quartiles (white column) of SD-LDLC. Mean ± SE after adjustment for age and sex. *P < 0.05.
| Journal of Clinical Medicine Research, ISSN 1918-3003 print, 1918-3011 online, Open Access |
| Article copyright, the authors; Journal compilation copyright, J Clin Med Res and Elmer Press Inc |
| Journal website http://www.jocmr.org |
Original Article
Volume 9, Number 4, April 2017, pages 310-316
Visit-to-Visit Low-Density Lipoprotein Cholesterol Variability Is an Independent Determinant of Carotid Intima-Media Thickness in Patients With Type 2 Diabetes
Figure
Tables
| Overall (n = 162) | Correlation coefficients | |||
|---|---|---|---|---|
| Maximum IMT | SD-LDLC | |||
| Mean ± SD or n, %. SD-LDLC: standard deviation of low-density lipoprotein cholesterol; OHA: oral hypoglycemic agents; CCB: calcium channel blockers; RASi: renin-angiotensin system inhibitors; PG: plasma glucose; CV: coefficient of variation; eGFR: estimated glomerular filtration rate; BP: blood pressure; ACR: albumin/creatinine ratio; IMT: intima-media thickness. *P < 0.05. **P < 0.01. ***P < 0.001. | ||||
| Male sex (n, %) | 89 (54.9) | -0.17* | Adjusted | 0.159* |
| Age (years) | 62 ± 10 | 0.29*** | Adjusted | -0.14 |
| Smokers (n, %) | 53 (32.7) | 0.06 | -0.01 | 0.04 |
| BMI (kg/m2) | 24.2 ± 3.7 | -0.02 | 0.05 | 0.06 |
| Waist circumference (cm) | 87.0 ± 10.0 | 0.07 | 0.12 | 0.2** |
| Duration of diabetes (years) | 9.7 ± 7.2 | 0.10 | -0.01 | 0.01 |
| Treatment of diabetes | ||||
| Diet/OHA/insulin (n, %) | 53/81/28 (33/50/17) | -0.01 | -0.02 | -0.03 |
| Users of CCB/RASi/diuretics (n, %) | 56/68/7 (35/42/4) | 0.15 | 0.10 | -0.06 |
| Users of hypolipidemic drugs (n, %) | 70 (43.2) | 0.17* | 0.22** | 0.26*** |
| HbA1c (%) | 7.0 ± 0.8 | 0.13 | 0.10 | 0.01 |
| Fasting PG (mg/dL) | 125 ± 23 | 0.03 | 0.00 | 0.02 |
| Post-breakfast PG (mg/dL) | 154 ± 48 | 0.06 | 0.01 | -0.11 |
| CV-HbA1c (%) | 6.7 ± 5.7 | -0.04 | 0.01 | 0.25*** |
| Total cholesterol (mg/dL) | 188 ± 21 | 0.02 | 0.11 | 0.27*** |
| LDLC (mg/dL) | 112 ± 22 | 0.12 | 0.19* | 0.28*** |
| SD-LDLC (mg/dL) | 15 ± 10 | 0.10 | 0.21* | 1 |
| HDLC (mg/dL) | 55 ± 15 | -0.18* | -0.13 | -0.07 |
| Fasting TG (mg/dL) | 114 ± 51 | 0.07 | 0.07 | 0.21** |
| Post-breakfast TG (mg/dL) | 145 ± 62 | 0.01 | -0.05 | 0.13 |
| Serum creatinine (mg/dL) | 0.8 ± 0.2 | 0.18* | 0.03 | -0.16* |
| eGFR (mL/min/1.73 m2) | 76 ± 16 | -0.13 | 0.01 | 0.18* |
| Uric acid (mg/dL) | 5.2 ± 1.3 | 0.10 | 0.03 | -0.12 |
| Systolic BP (mm Hg) | 128 ± 12 | 0.13 | 0.09 | 0.06 |
| SD-systolic BP (mm Hg) | 8.1 ± 2.2 | 0.20* | 0.15 | -0.01 |
| Diastolic BP (mm Hg) | 72 ± 6 | 0.00 | 0.08 | 0.12 |
| Urinary ACR (mg/g) | 86 ± 327 | 0.01 | -0.01 | 0.06 |
| Log ACR | 1.3 ± 0.6 | 0.23** | 0.18* | 0.06 |
| Leucocyte count (103/μL) | 5.8 ± 1.5 | 0.05 | 0.03 | 0.14 |
| Maximum IMT (mm) | 1.04 ± 0.30 | 1 | 1 | 0.10 |
| Mean IMT (mm) | 0.83 ± 0.18 | 0.93*** | 0.92*** | 0.05 |
| ACR ≥ 30 mg/g (n, %) | 53 (32.7) | 0.20* | 0.15 | 0.034 |
| eGFR < 60 mL/min/1.73 m2) | 25 (15.4) | 0.11 | 0.03 | -0.12 |
| Chronic kidney disease (n, %) | 66 (40.7) | 0.18* | 0.10 | 0.00 |
| Independent variables | Standardized β | Cumulative R2 | P values |
|---|---|---|---|
| Other independent variables included mean LDLC, BMI, waist circumference, duration and treatment of diabetes, means and SDs of systolic blood pressure, glycemic and other lipid variables, and uses of hypolipidemic and anti-hypertensive medications. | |||
| Sex | 0.355 | 0.083 | < 0.001 |
| Age | 0.234 | 0.117 | 0.002 |
| SD-LDLC | 0.201 | 0.151 | 0.009 |
| Quartiles of SD-LDLC | P values | ||
|---|---|---|---|
| Other three (n = 122) | Highest (n = 40) | ||
| Mean ± SD or n, %. SD-LDLC: standard deviation of low-density lipoprotein cholesterol; OHA: oral hypoglycemic agents; CCB: calcium channel blockers; RASi: renin-angiotensin system inhibitors; PG: plasma glucose; CV: coefficient of variation; eGFR: estimated glomerular filtration rate; BP: blood pressure; ACR: albumin/creatinine ratio; IMT: intima-media thickness. | |||
| Male sex (n, %) | 69 (57) | 20 (50) | 0.47 |
| Age (years) | 63 ± 10 | 60 ± 11 | 0.15 |
| Smokers (n, %) | 39 (32) | 14 (35) | 0.75 |
| BMI (kg/m2) | 24.1 ± 3.7 | 24.6 ± 3.8 | 0.49 |
| Waist circumference (cm) | 86.2 ± 8.4 | 89.4 ± 13.6 | 0.08 |
| Duration of diabetes (years) | 9.4 ± 7.1 | 10.5 ± 7.8 | 0.40 |
| Treatment of diabetes | |||
| Diet/OHA/insulin (n, %) | 41/58/23 (34/48/19) | 12/23/5 (30/58/13) | 0.49 |
| Users of CCB/RASi/diuretics (n, %) | 46/53/6 (38/43/5) | 10/15/1 (25/38/3) | 0.32 |
| Users of hypolipidemic drugs (n, %) | 38 (31) | 23 (58) | 0.003 |
| HbA1c (%) | 7.0 ± 0.9 | 7.0 ± 0.8 | 0.94 |
| Fasting PG (mg/dL) | 125 ± 22 | 126 ± 24 | 0.79 |
| Post-breakfast PG (mg/dL) | 157 ± 49 | 142 ± 46 | 0.11 |
| CV-HbA1c (%) | 5.9 ± 5.2 | 9.1 ± 6.7 | 0.002 |
| Total cholesterol (mg/dL) | 185 ± 21 | 197 ± 20 | 0.003 |
| LDLC (mg/dL) | 109 ± 22 | 121 ± 21 | 0.002 |
| SD-LDLC (mg/dL) | 11 ± 4 | 30 ± 8 | 0.000 |
| HDLC (mg/dL) | 56 ± 16 | 54 ± 14 | 0.47 |
| Fasting TG (mg/dL) | 109 ± 49 | 132 ± 52 | 0.01 |
| Post-breakfast TG (mg/dL) | 140 ± 61 | 164 ± 65 | 0.05 |
| Serum creatinine (mg/dL) | 0.8 ± 0.2 | 0.7 ± 0.2 | 0.34 |
| eGFR (mL/min/1.73 m2) | 75 ± 16 | 79 ± 18 | 0.10 |
| Uric acid (mg/dL) | 5.2 ± 1.4 | 5.2 ± 1.0 | 0.85 |
| Systolic BP (mm Hg) | 128 ± 12 | 129 ± 11 | 0.50 |
| SD-systolic BP (mm Hg) | 10.3 ± 3.0 | 10.2 ± 3.0 | 0.78 |
| Diastolic BP (mm Hg) | 72 ± 7 | 74 ± 6 | 0.15 |
| Urinary ACR (mg/g) | 47 ± 128 | 203 ± 608 | 0.01 |
| Log ACR | 1.3 ± 0.5 | 1.4 ± 0.7 | 0.10 |
| Leucocyte count (103/μL) | 5.7 ± 1.4 | 6.2 ± 1.6 | 0.06 |
| Maximum IMT (mm) | 1.03 ± 0.27 | 1.10 ± 0.39 | 0.17 |
| Mean IMT (mm) | 0.83 ± 0.18 | 0.85 ± 0.19 | 0.49 |
| ACR ≥ 30 mg/g (n, %) | 37 (30) | 16 (40) | 0.26 |
| Independent variables | Standardized β | Cumulative R2 | P values |
|---|---|---|---|
| Independent variables included waist circumference, users of hypolipidemic drugs, CV-HbA1c, mean LDLC, fasting TG, and eGFR. SD-LDLC: standard deviation of low-density lipoprotein cholesterol; OHA: oral hypoglycemic agents; CCB: calcium channel blockers; RASi: renin-angiotensin system inhibitors; PG: plasma glucose; CV: coefficient of variation; eGFR: estimated glomerular filtration rate; BP: blood pressure; ACR: albumin/creatinine ratio; IMT: intima-media thickness. | |||
| LDLC | 0.232 | 0.069 | 0.001 |
| CV-HbA1c | 0.189 | 0.124 | 0.011 |
| Users of hypolipidemic drugs | 0.247 | 0.180 | 0.001 |
| Fasting TG | 0.172 | 0.197 | 0.018 |
| eGFR | 0.151 | 0.213 | 0.039 |