Figures
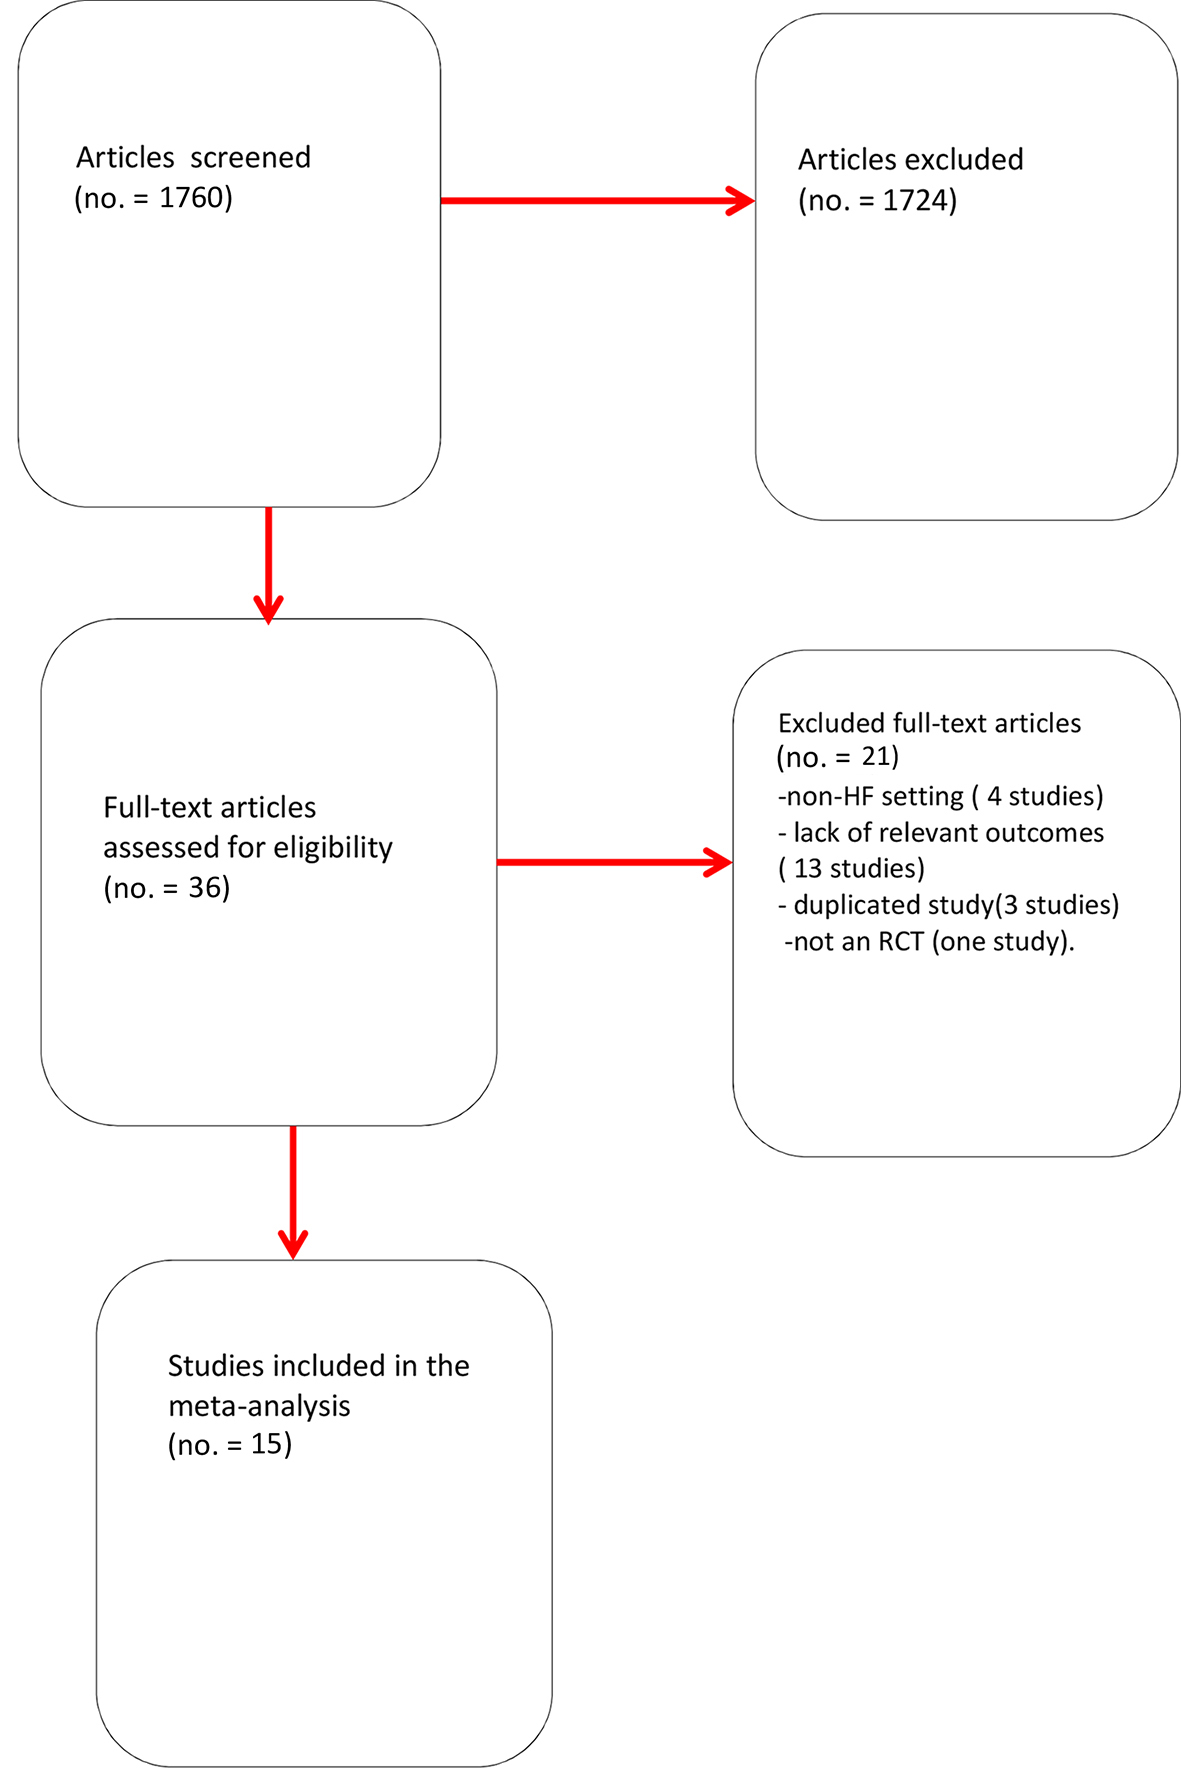
Figure 1. Flow diagram for meta-analysis. Overview of process used to identify studies suitable for inclusion in the meta-analysis.
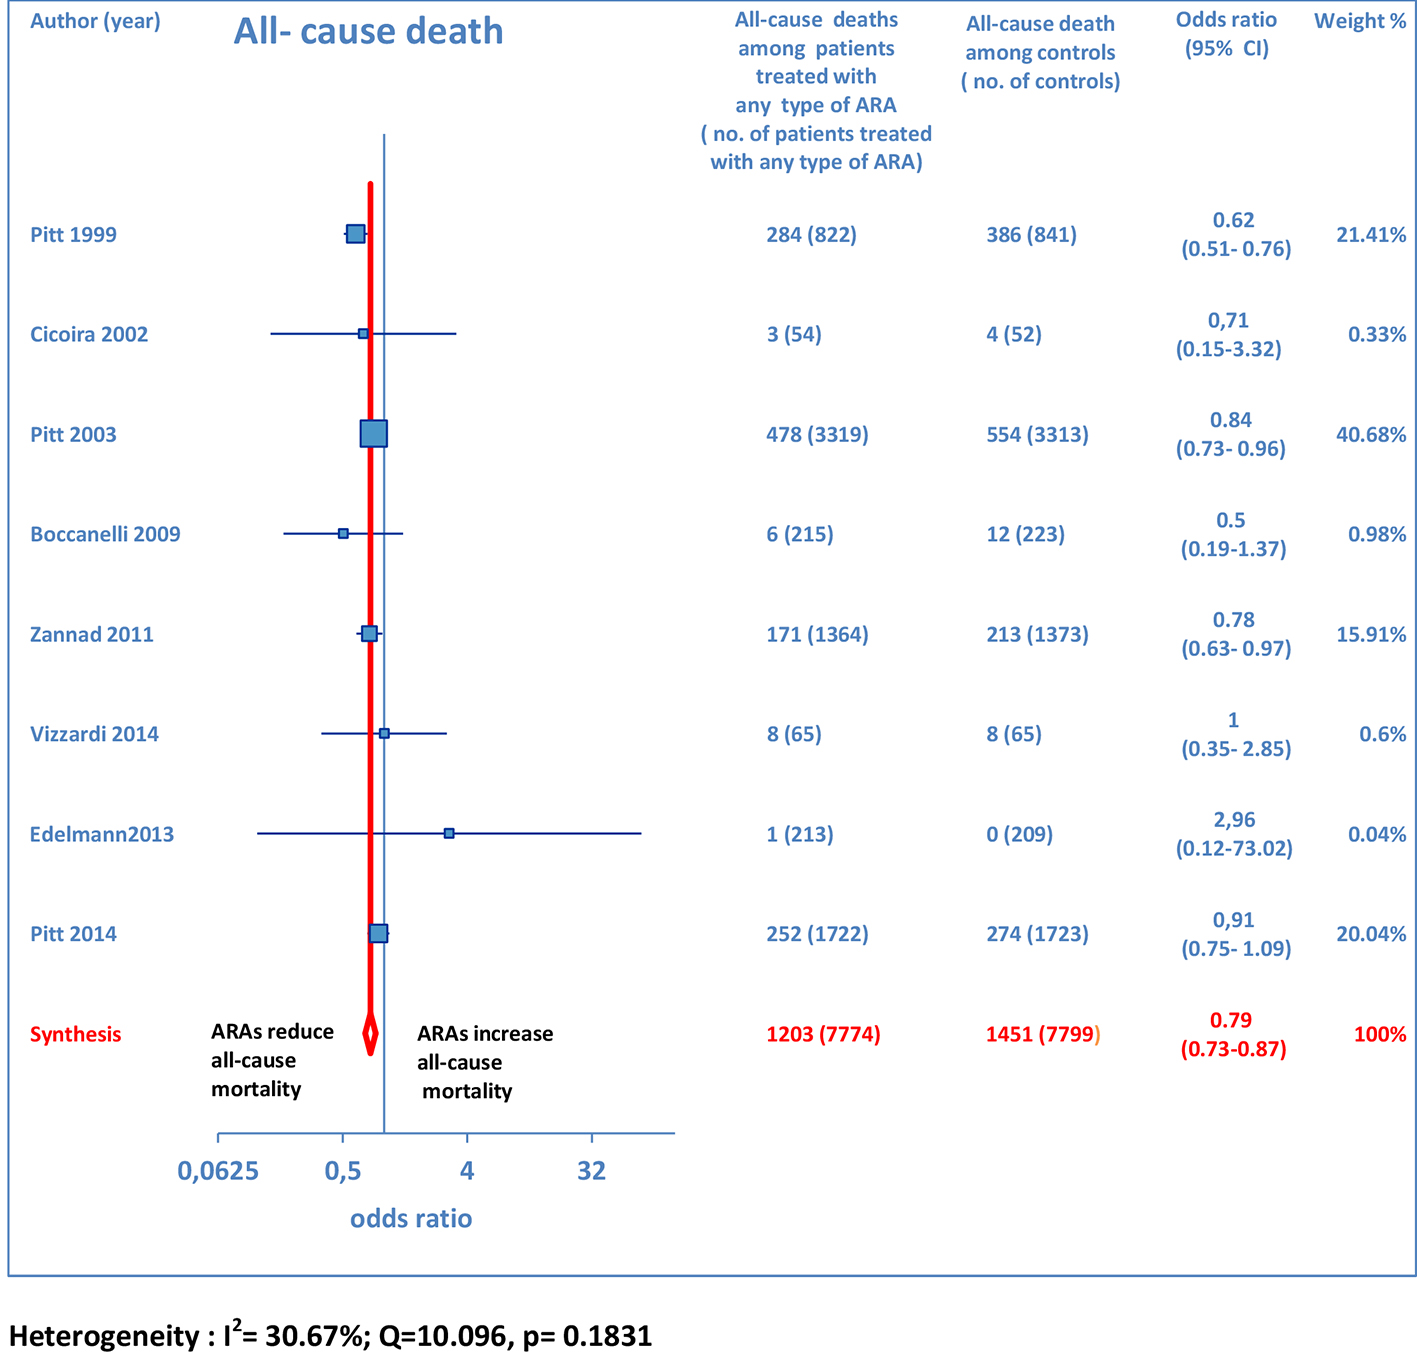
Figure 2. Forest plot of all-cause mortality with ARA use in HF. Eight trials reported all-cause mortality rates with ARA use in HF patients compared to controls.
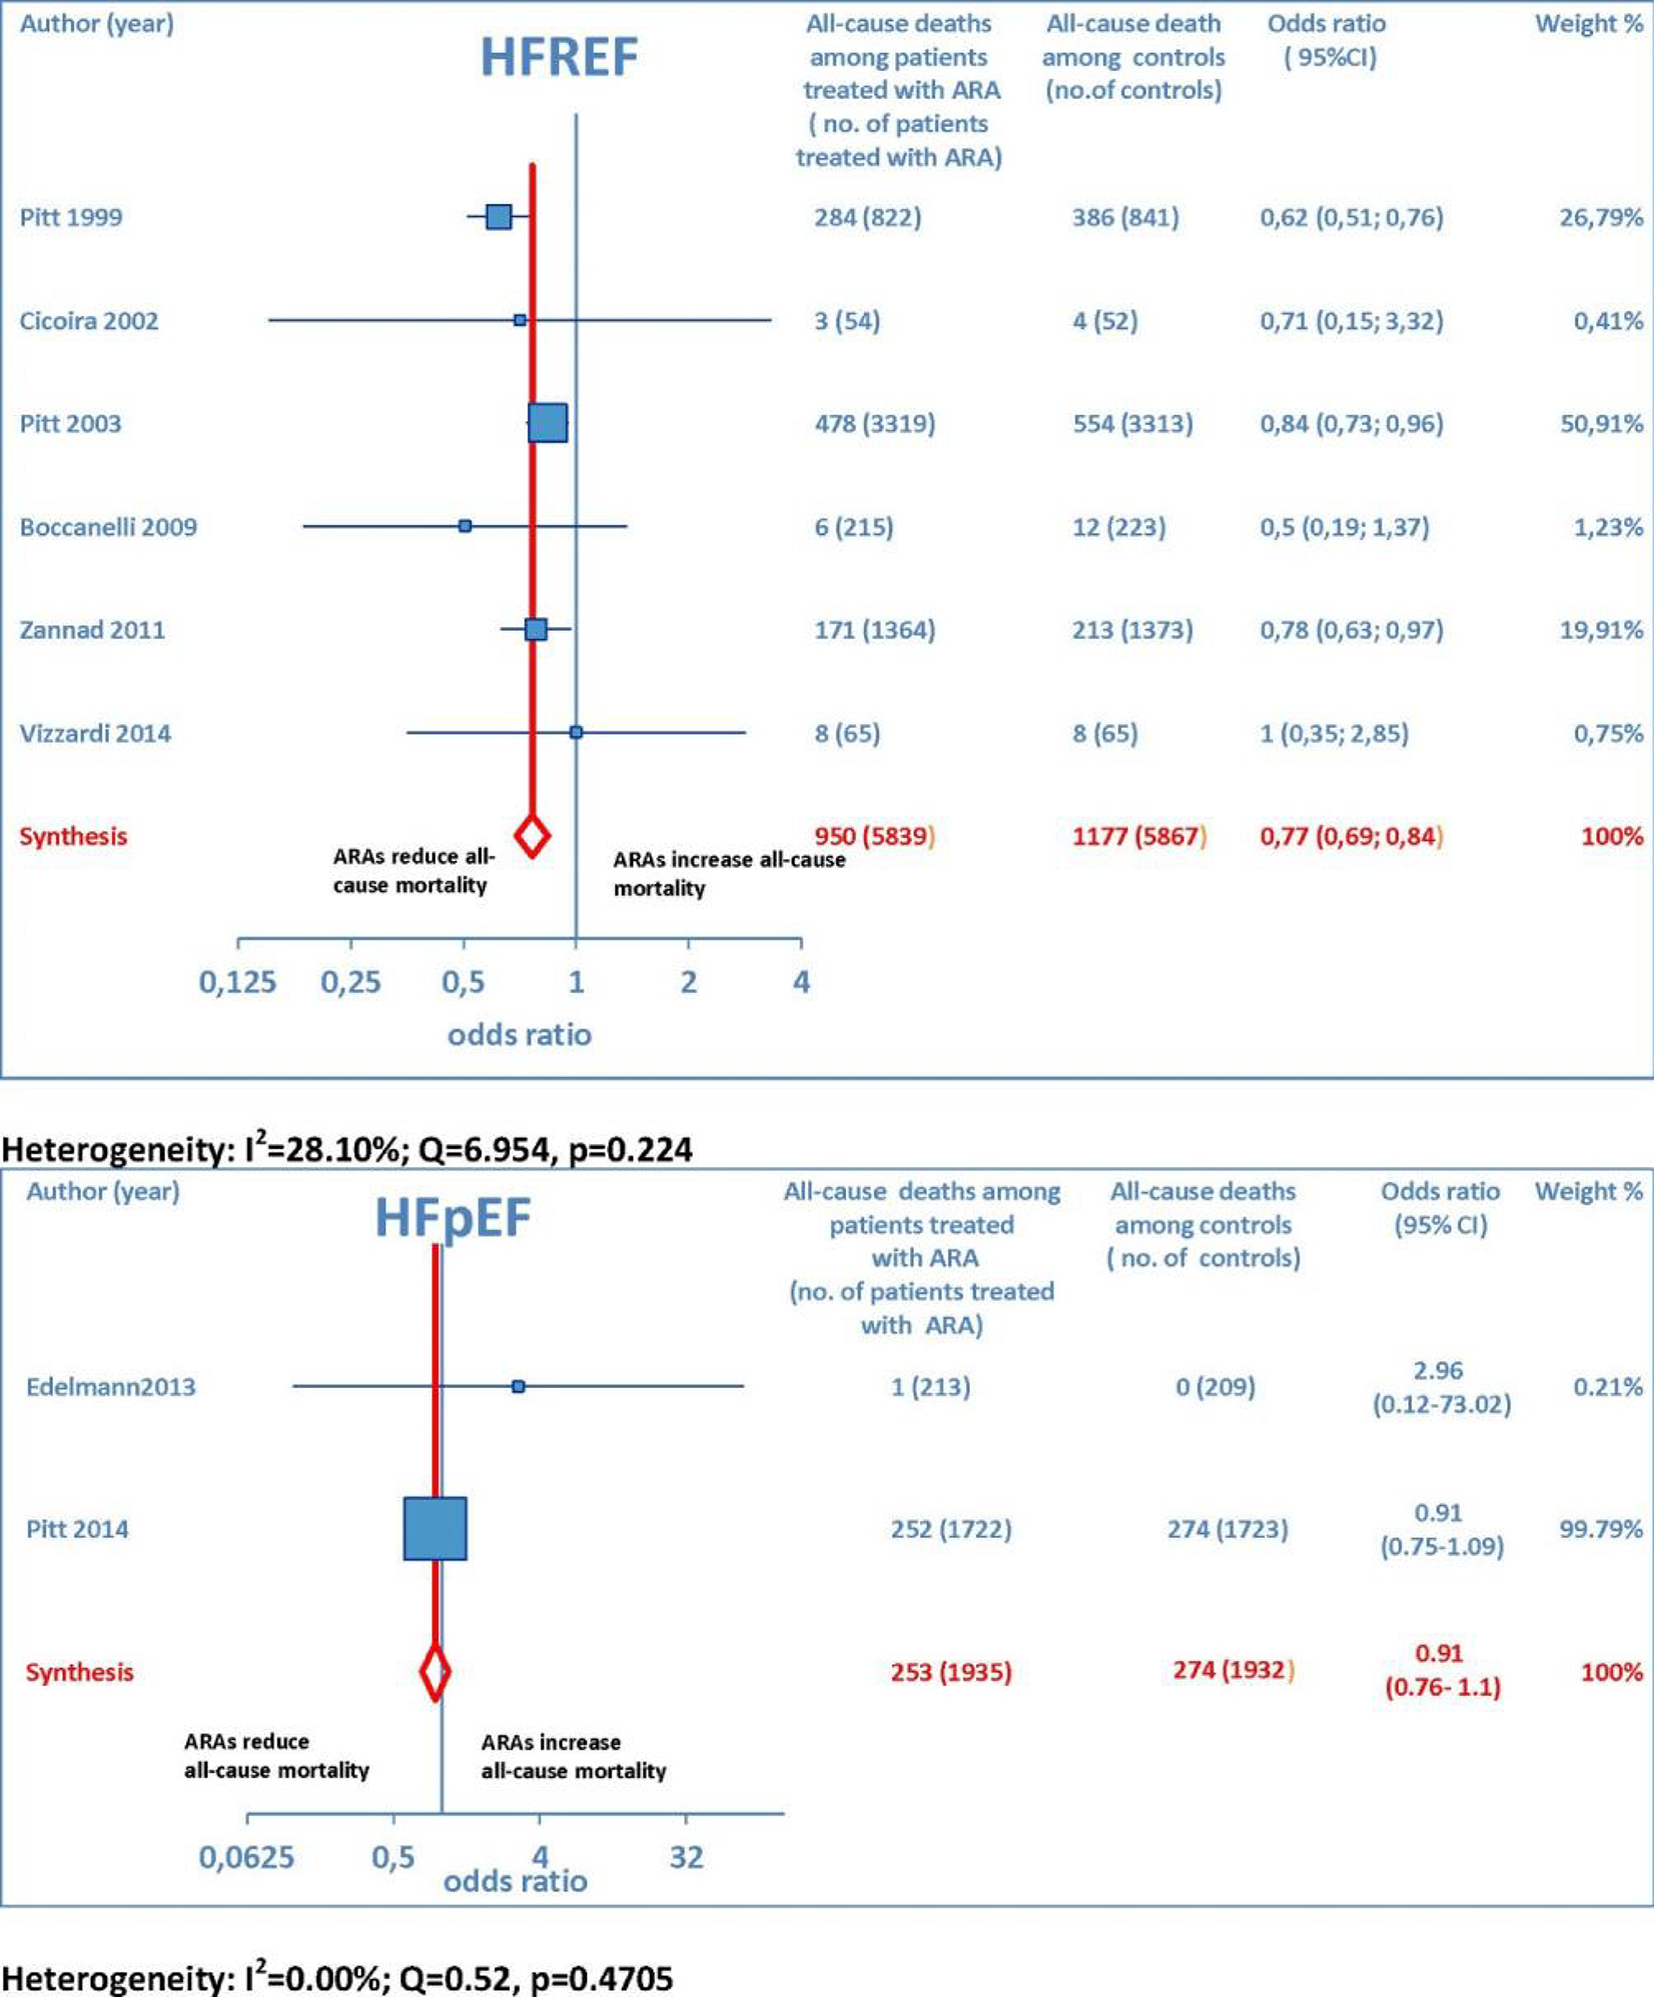
Figure 3. The forest plot of all-cause mortality with ARA use has been subdivided according to HF type.
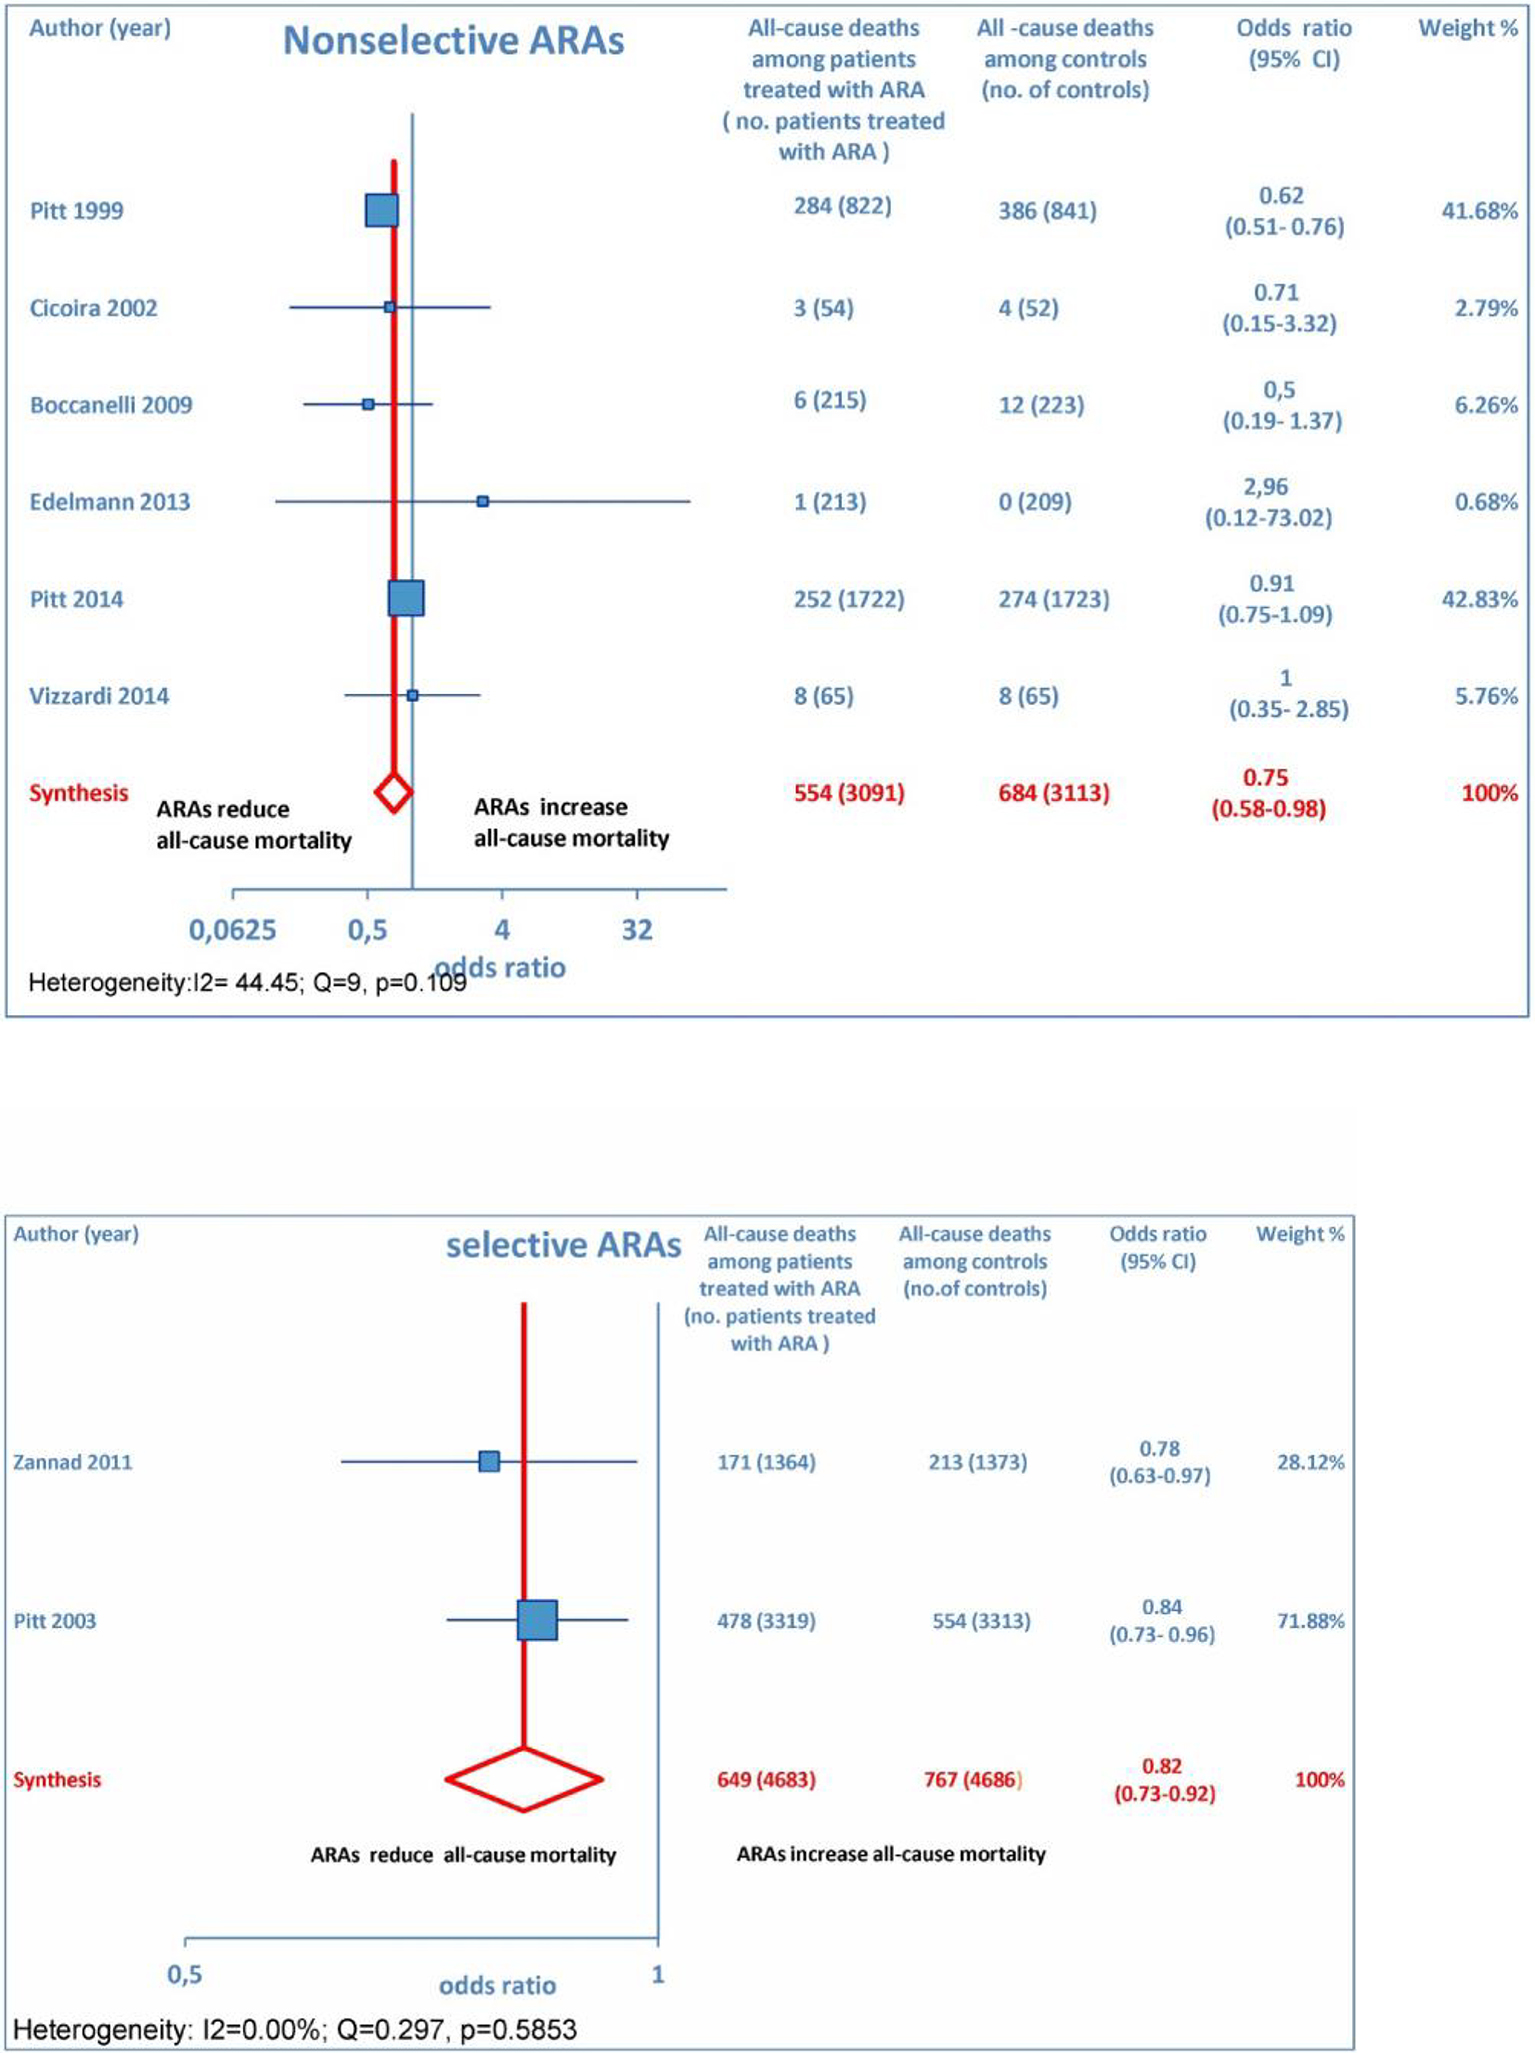
Figure 4. The forest plot of all-cause mortality has been subdivided according to ARA type (whether non-selective or selective).
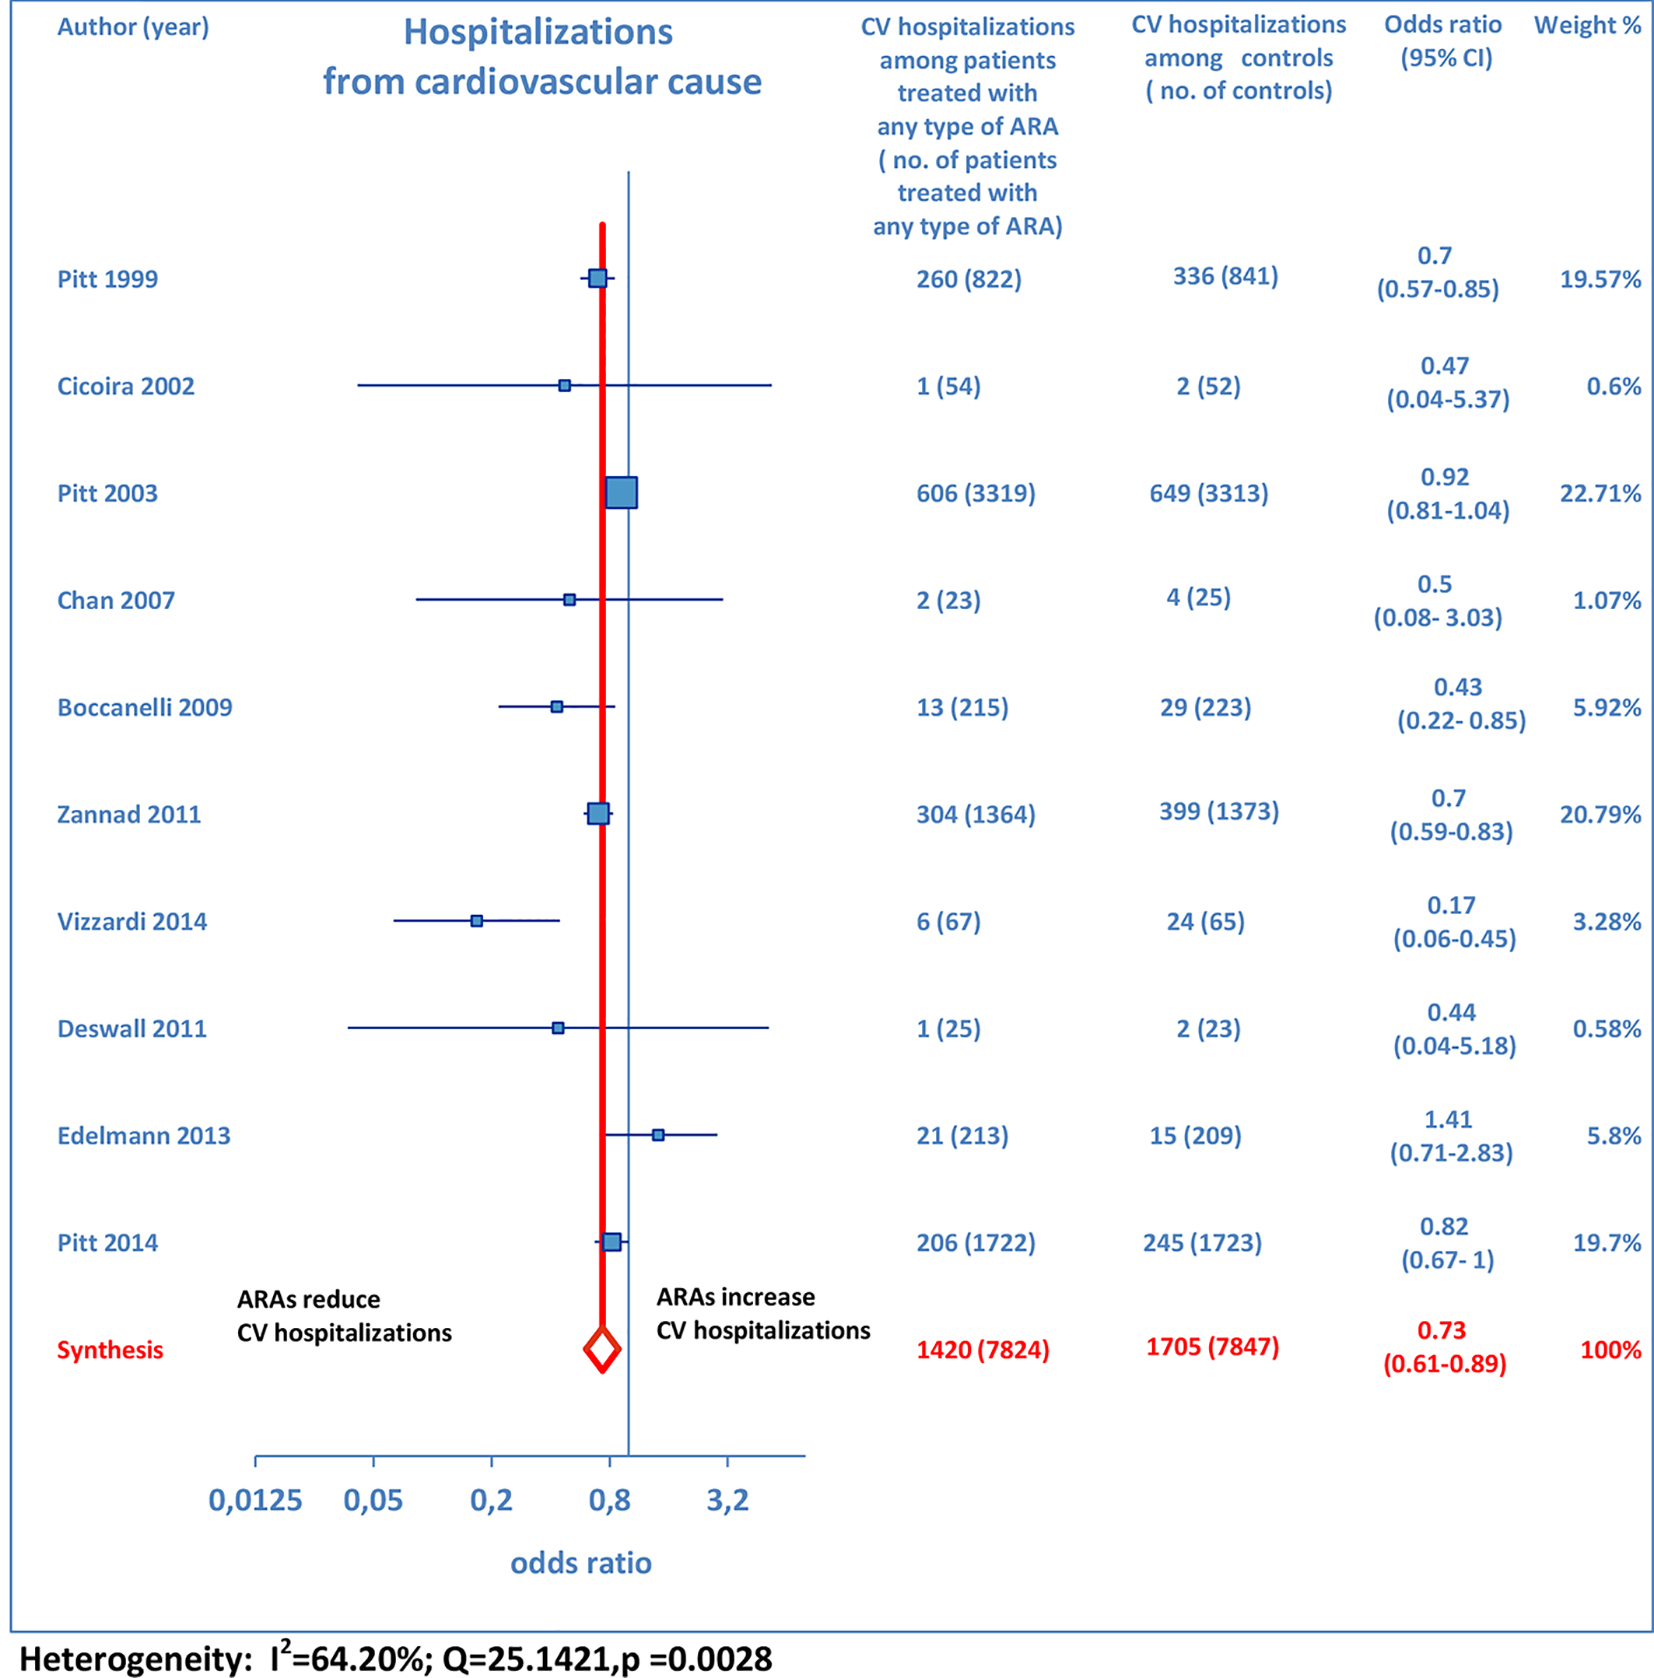
Figure 5. Forest plot of hospitalizations from cardiovascular cause with ARA use in HF. Ten trials reported cardiovascular hospitalization rates with ARA use in HF patients compared to controls.
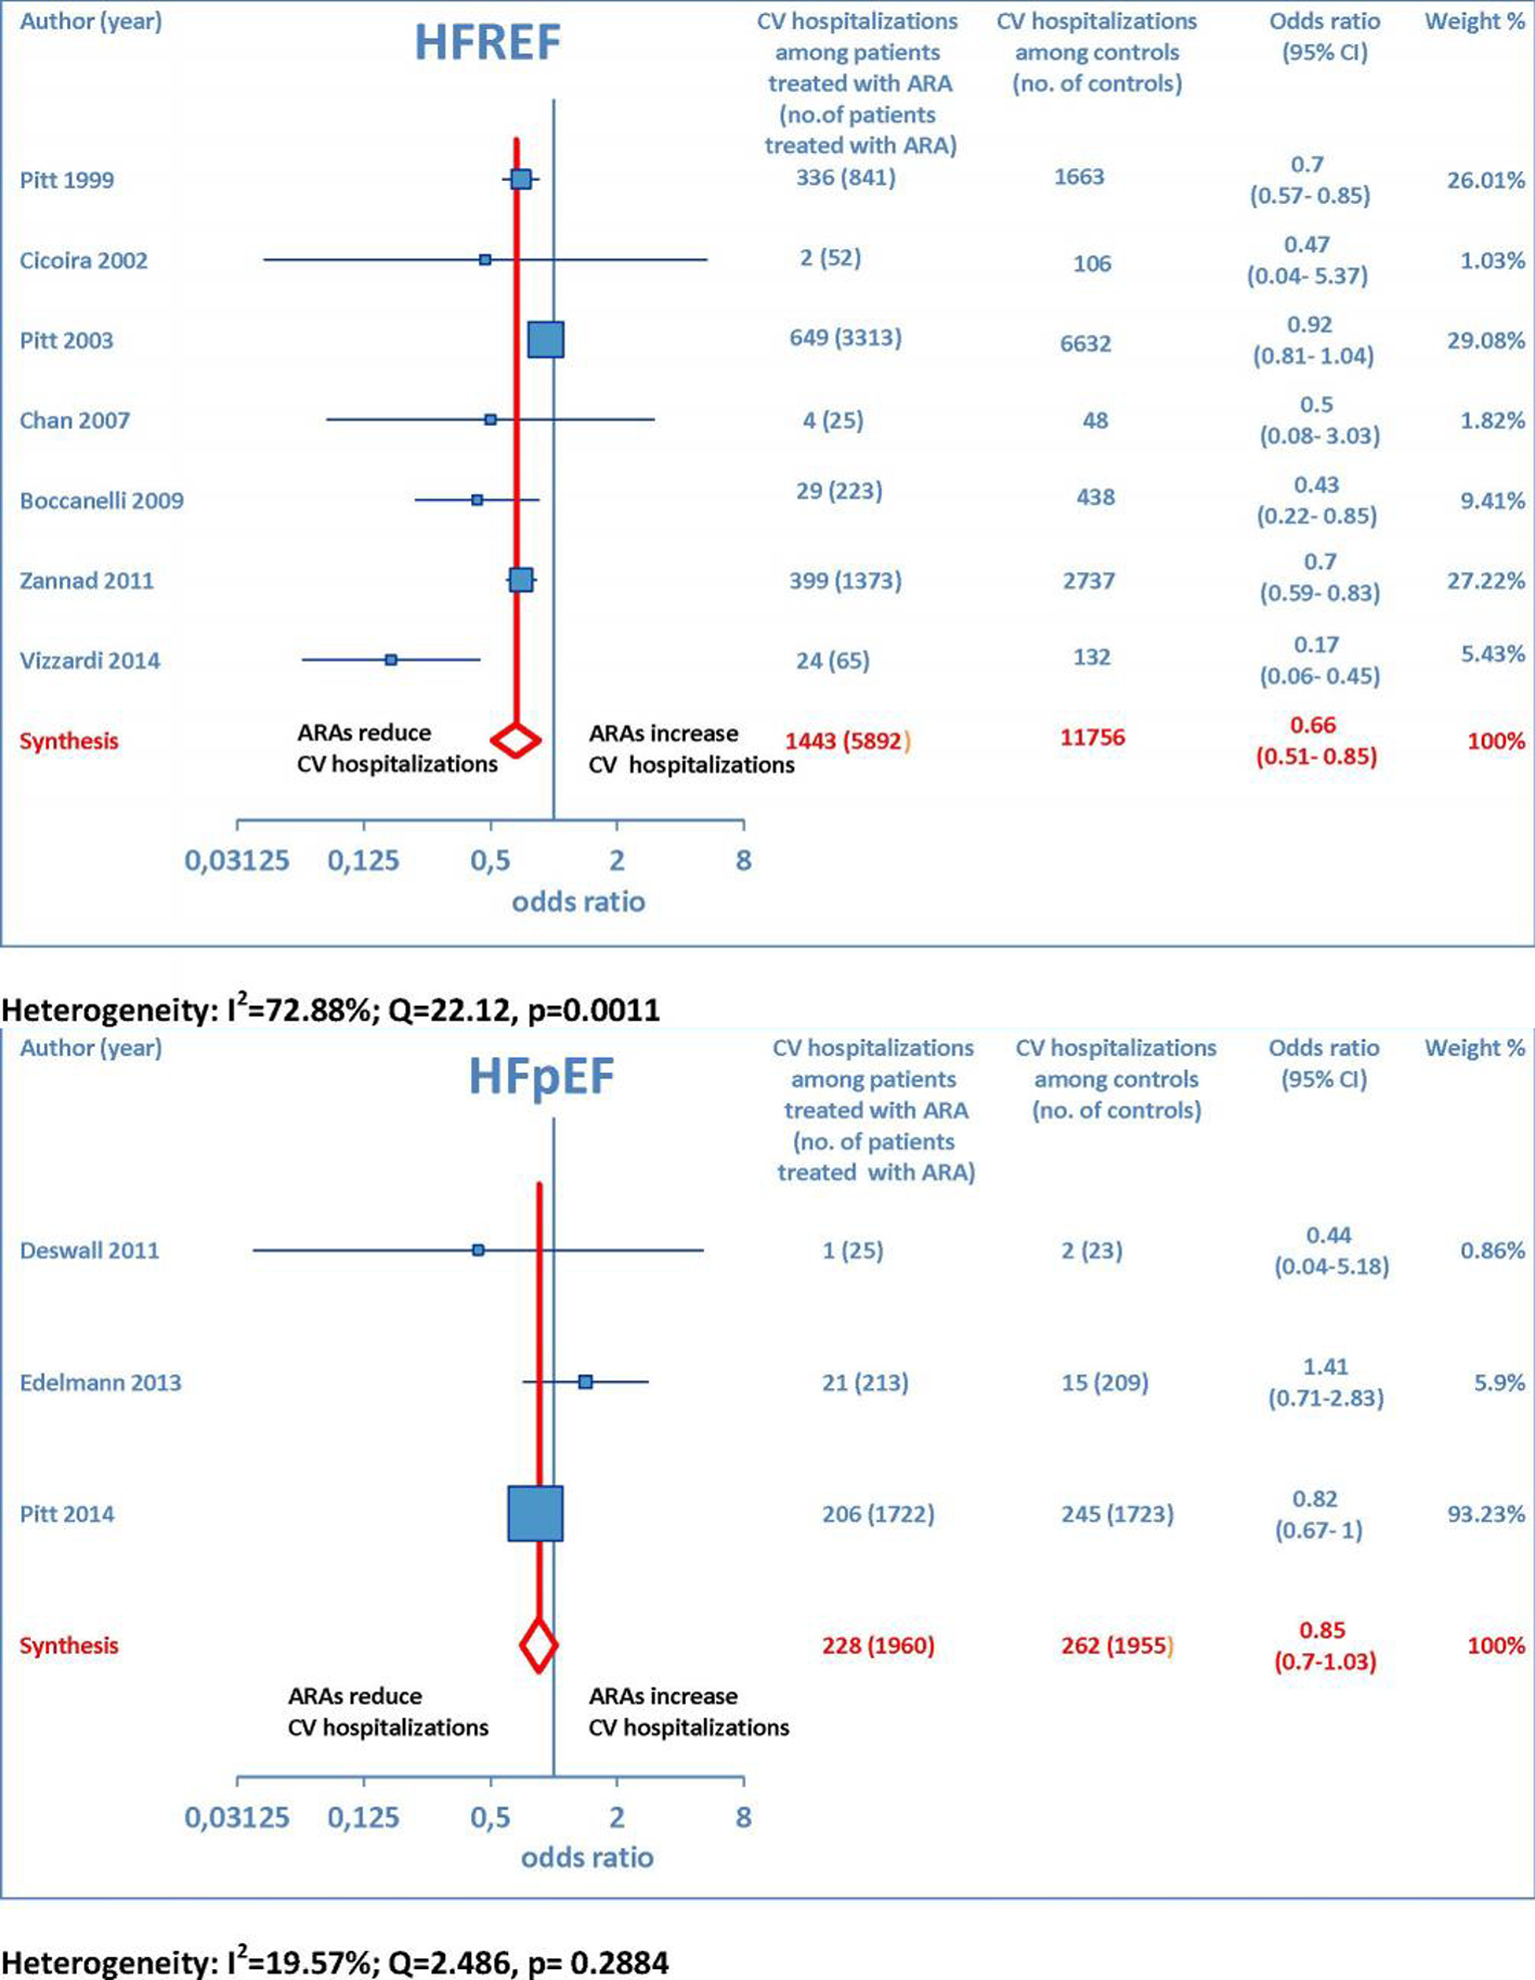
Figure 6. The forest plot of cardiovascular hospitalizations has been subdivided according to HF type.
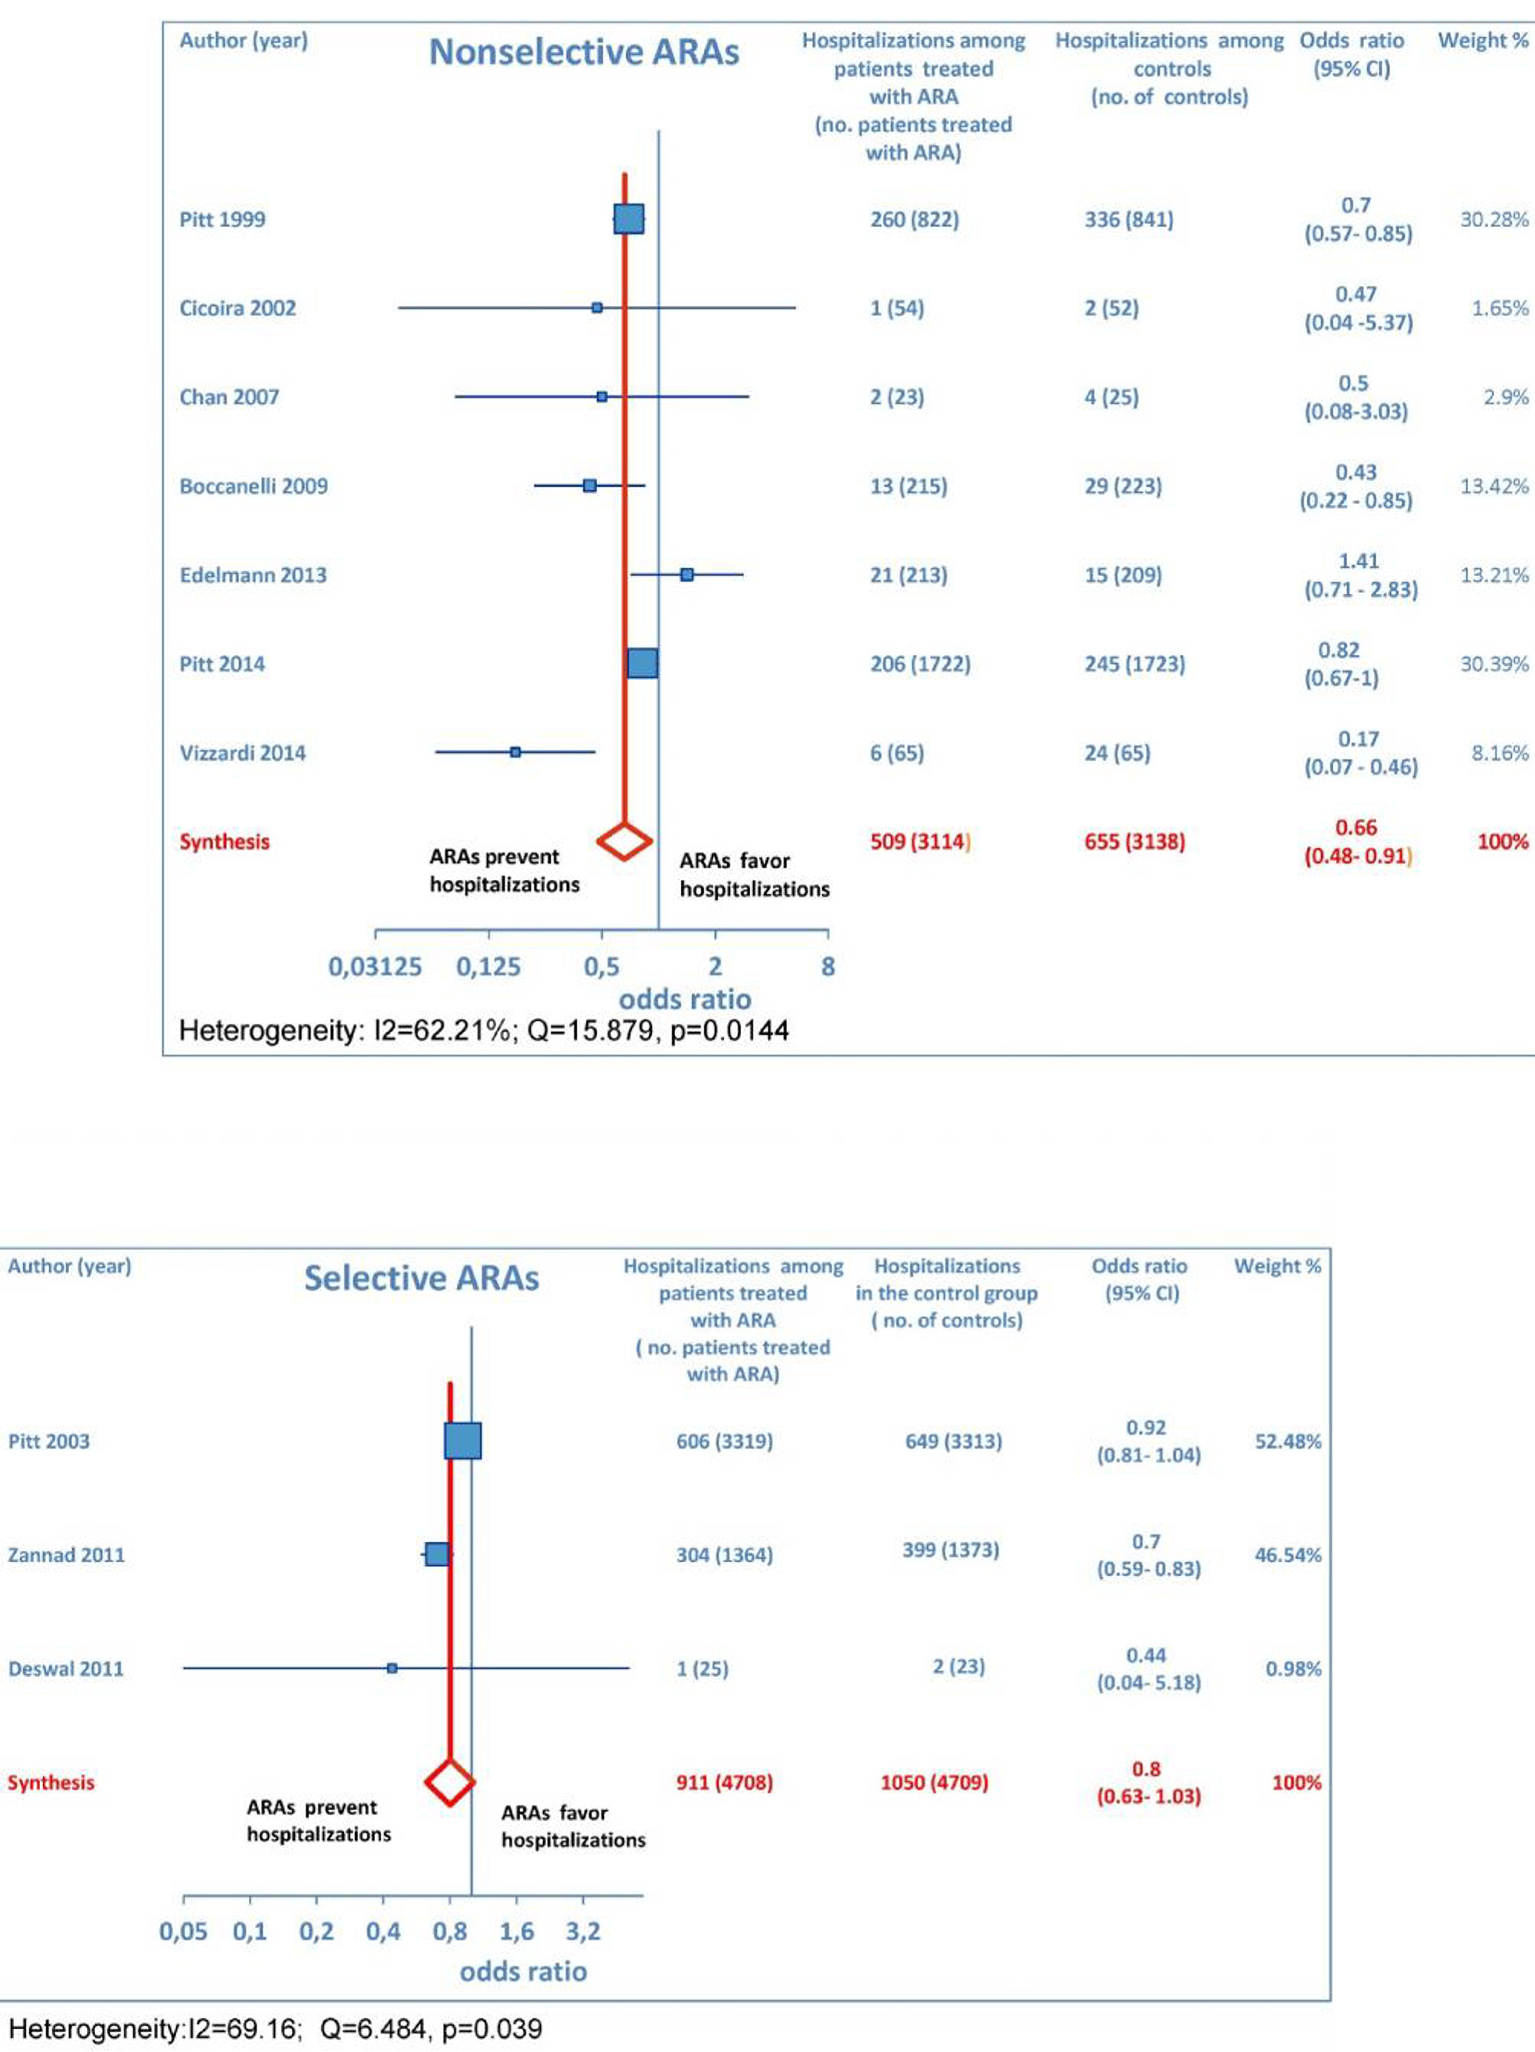
Figure 7. The forest plot of cardiovascular hospitalizations has been subdivided according to ARA type (whether non-selective or selective).
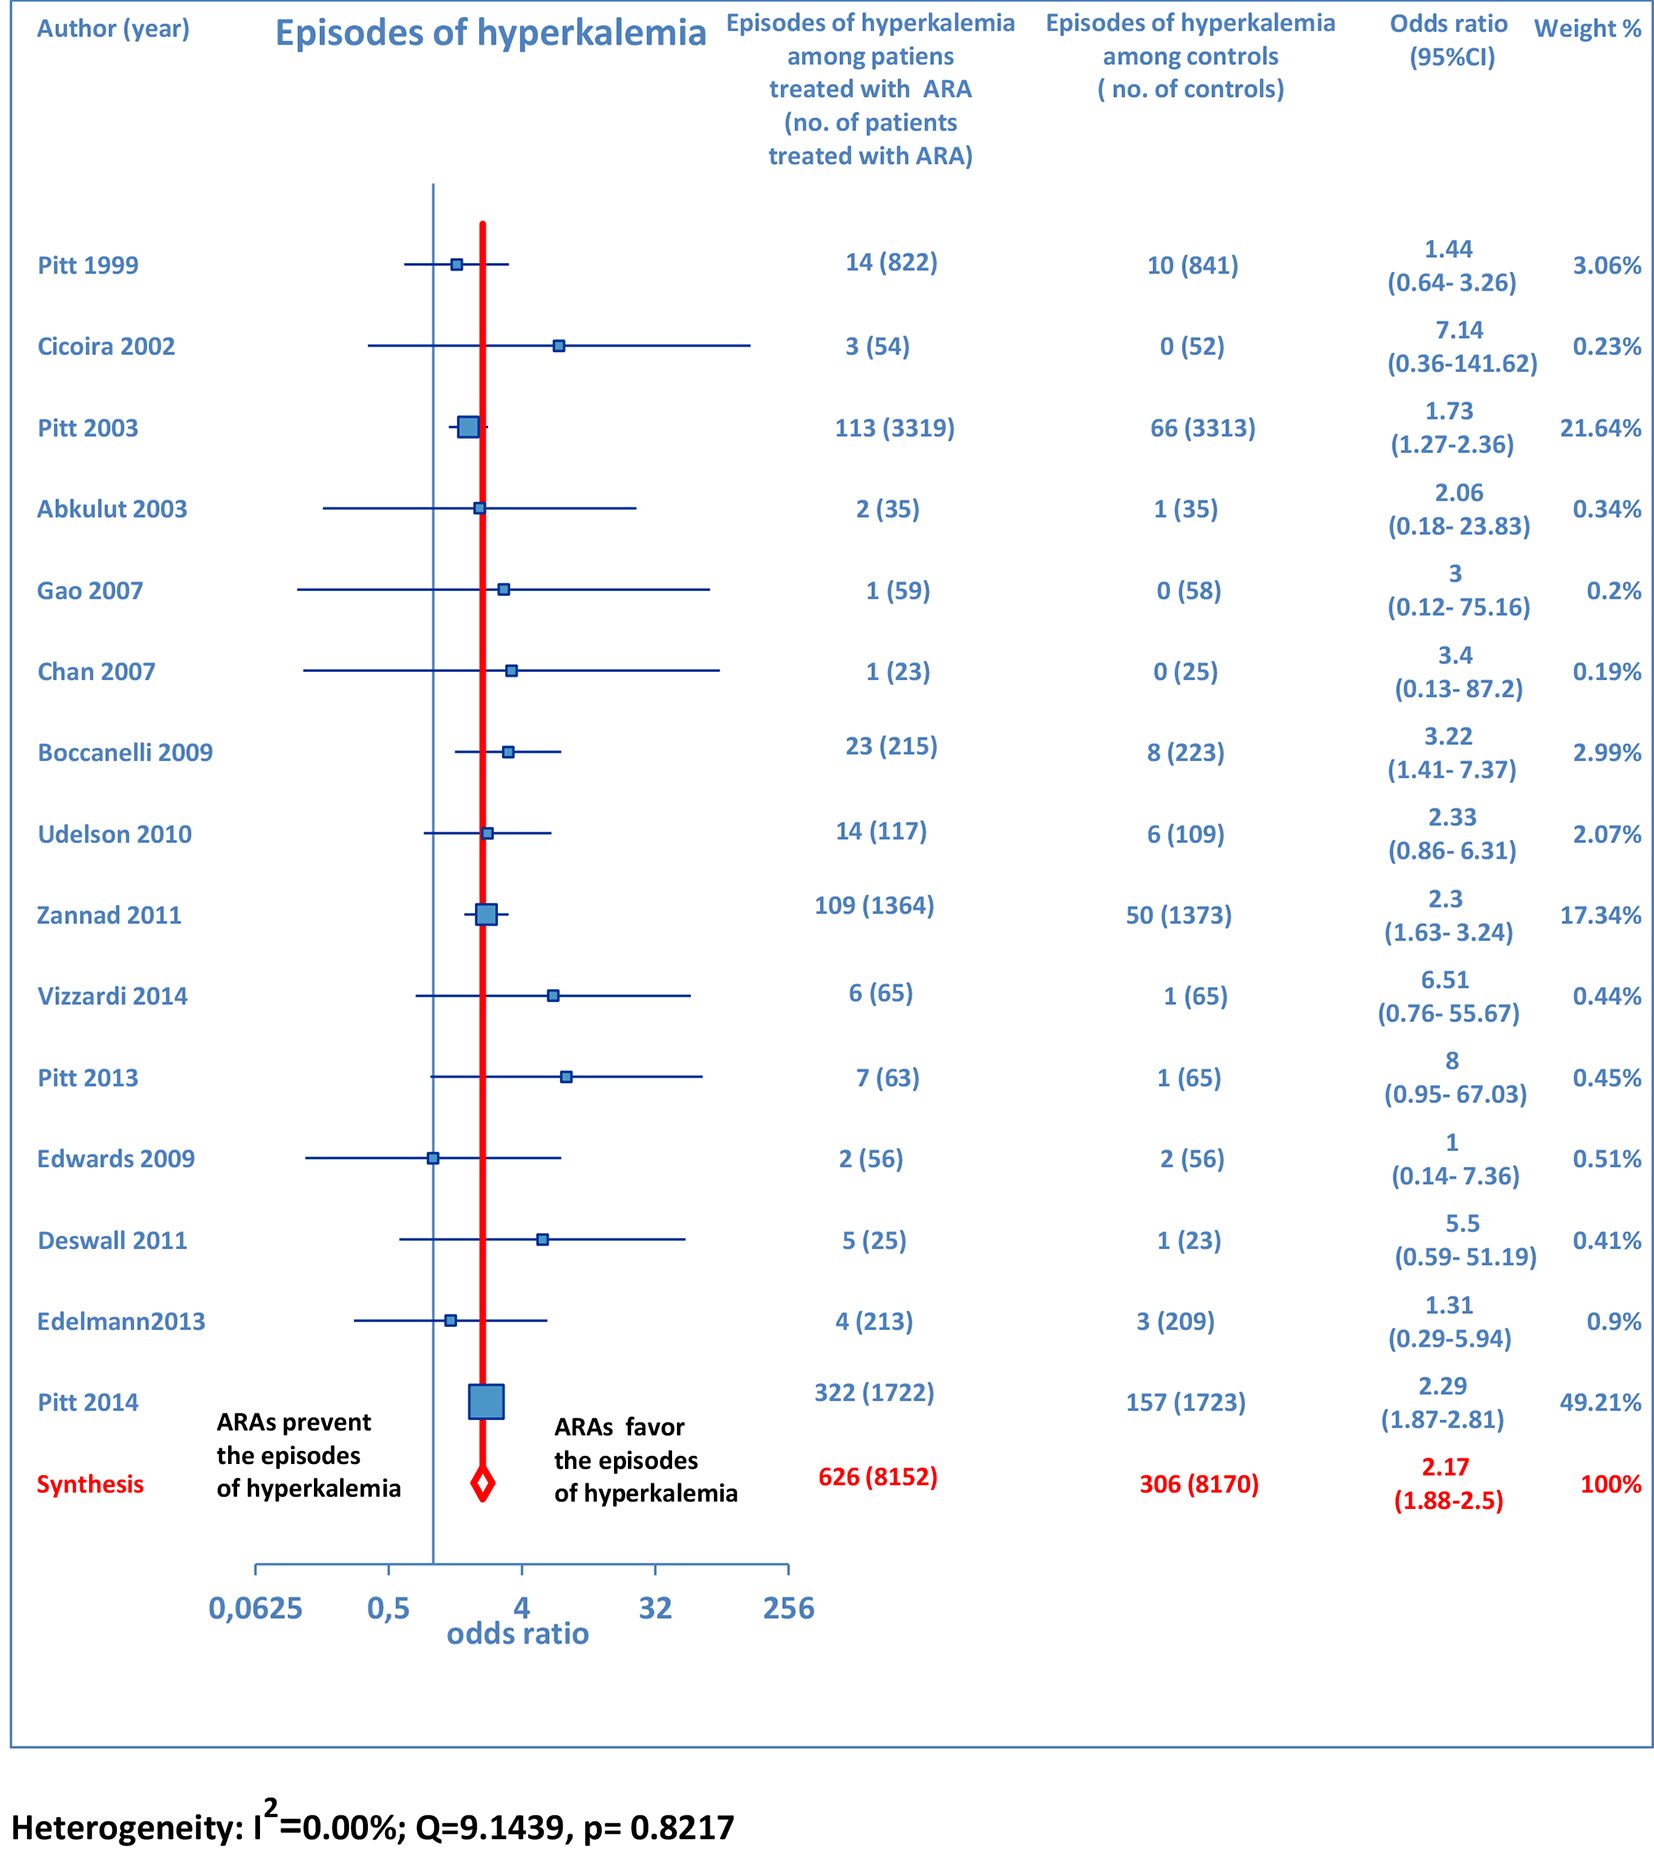
Figure 8. Forest plot of hyperkalemia with ARA use in HF. Fifteen trials reported hyperkalemia rates with ARA use in HF patients compared to controls.
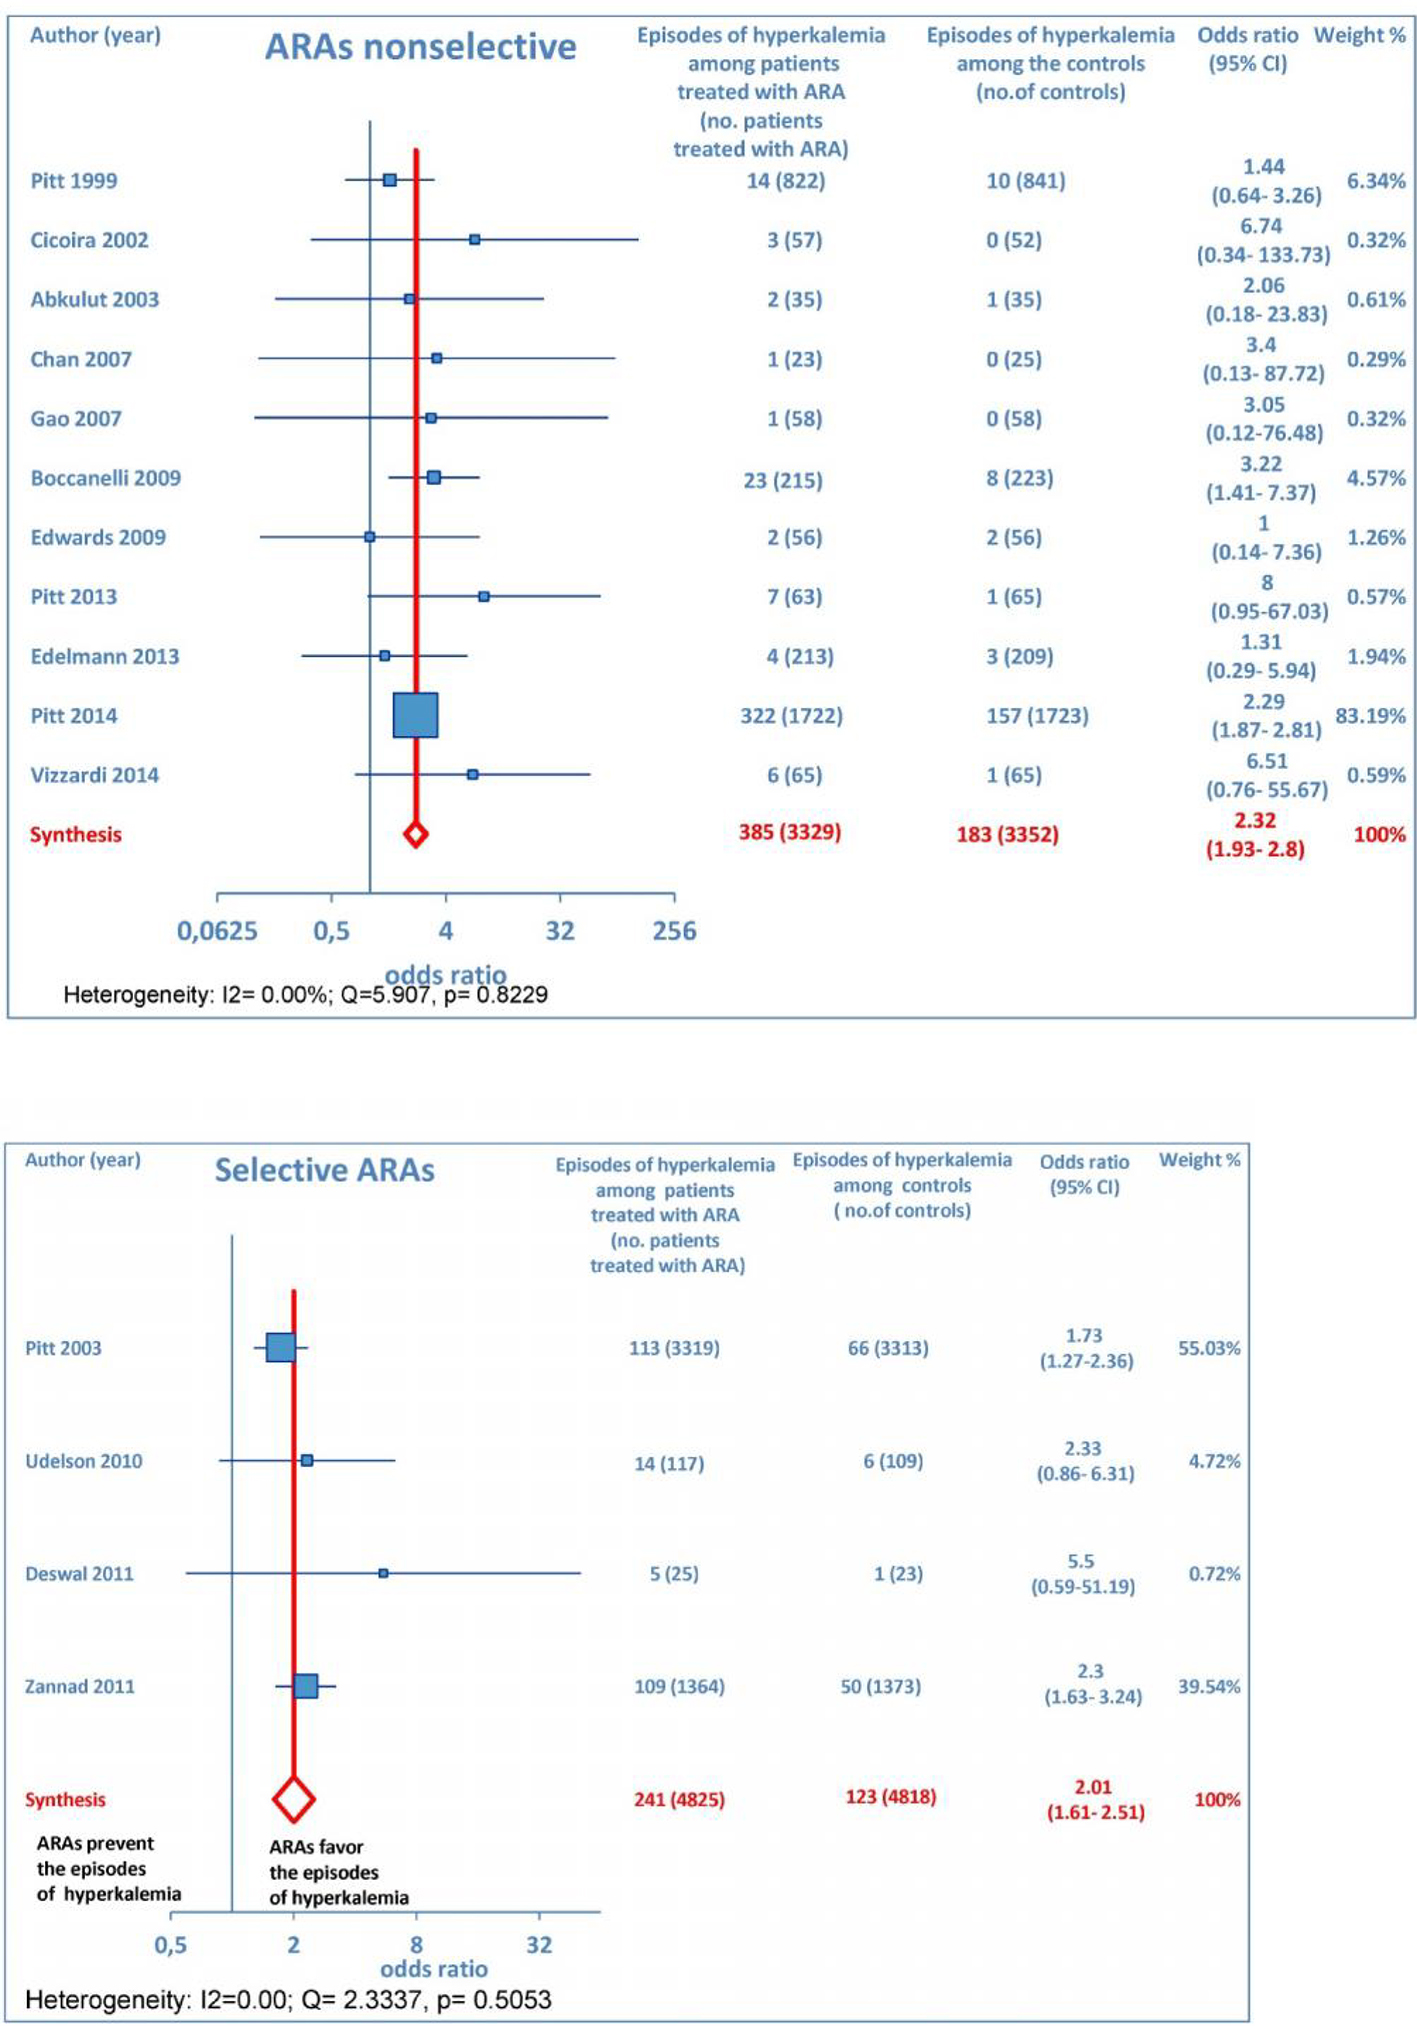
Figure 9. The forest plot of hyperkalemia has been subdivided according to ARA type (whether non-selective or selective).
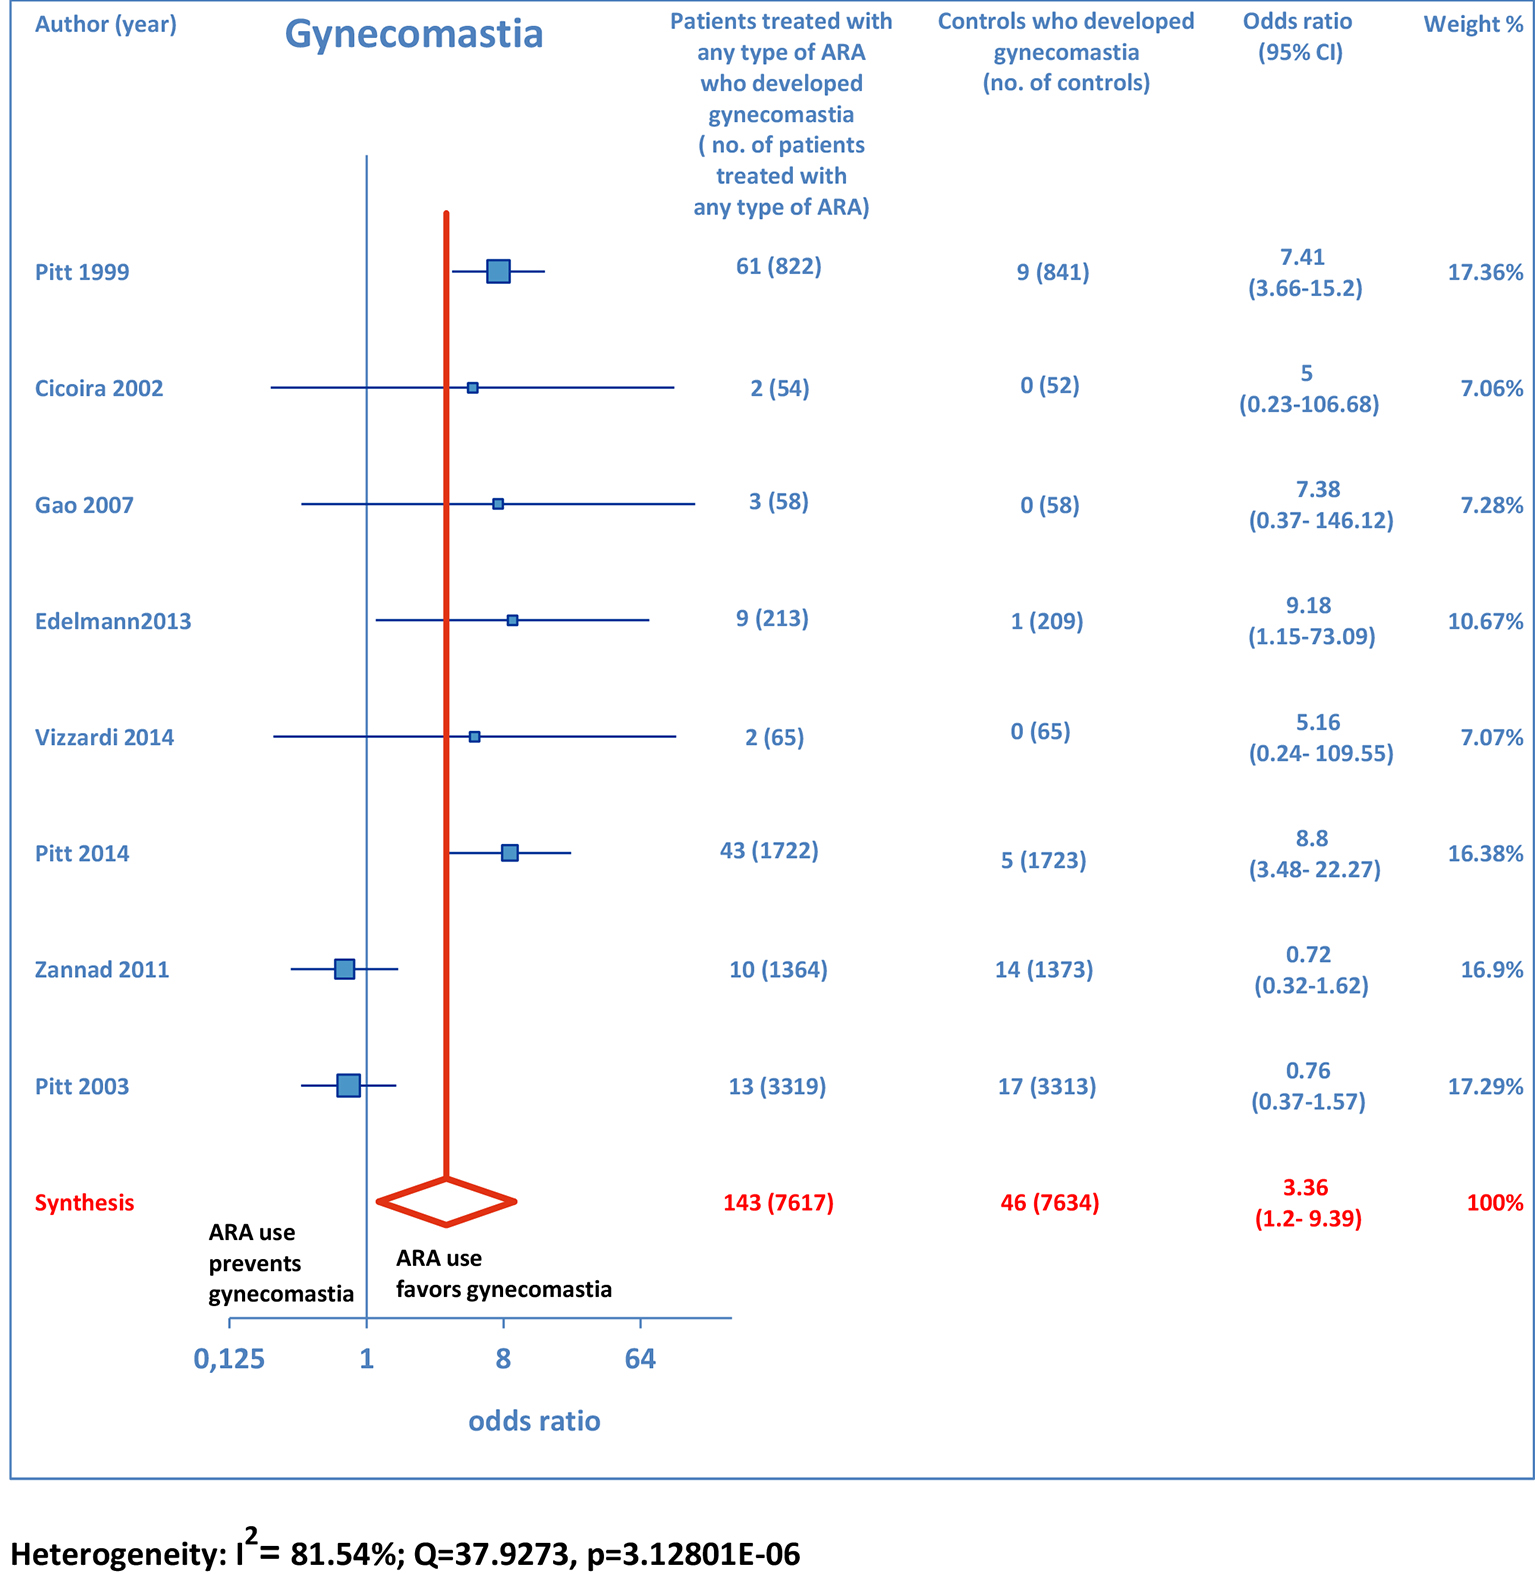
Figure 10. Forest plot of gynecomastia with ARA use in HF. Eight trials reported gynecomastia rates with ARA use in HF patients compared to controls.
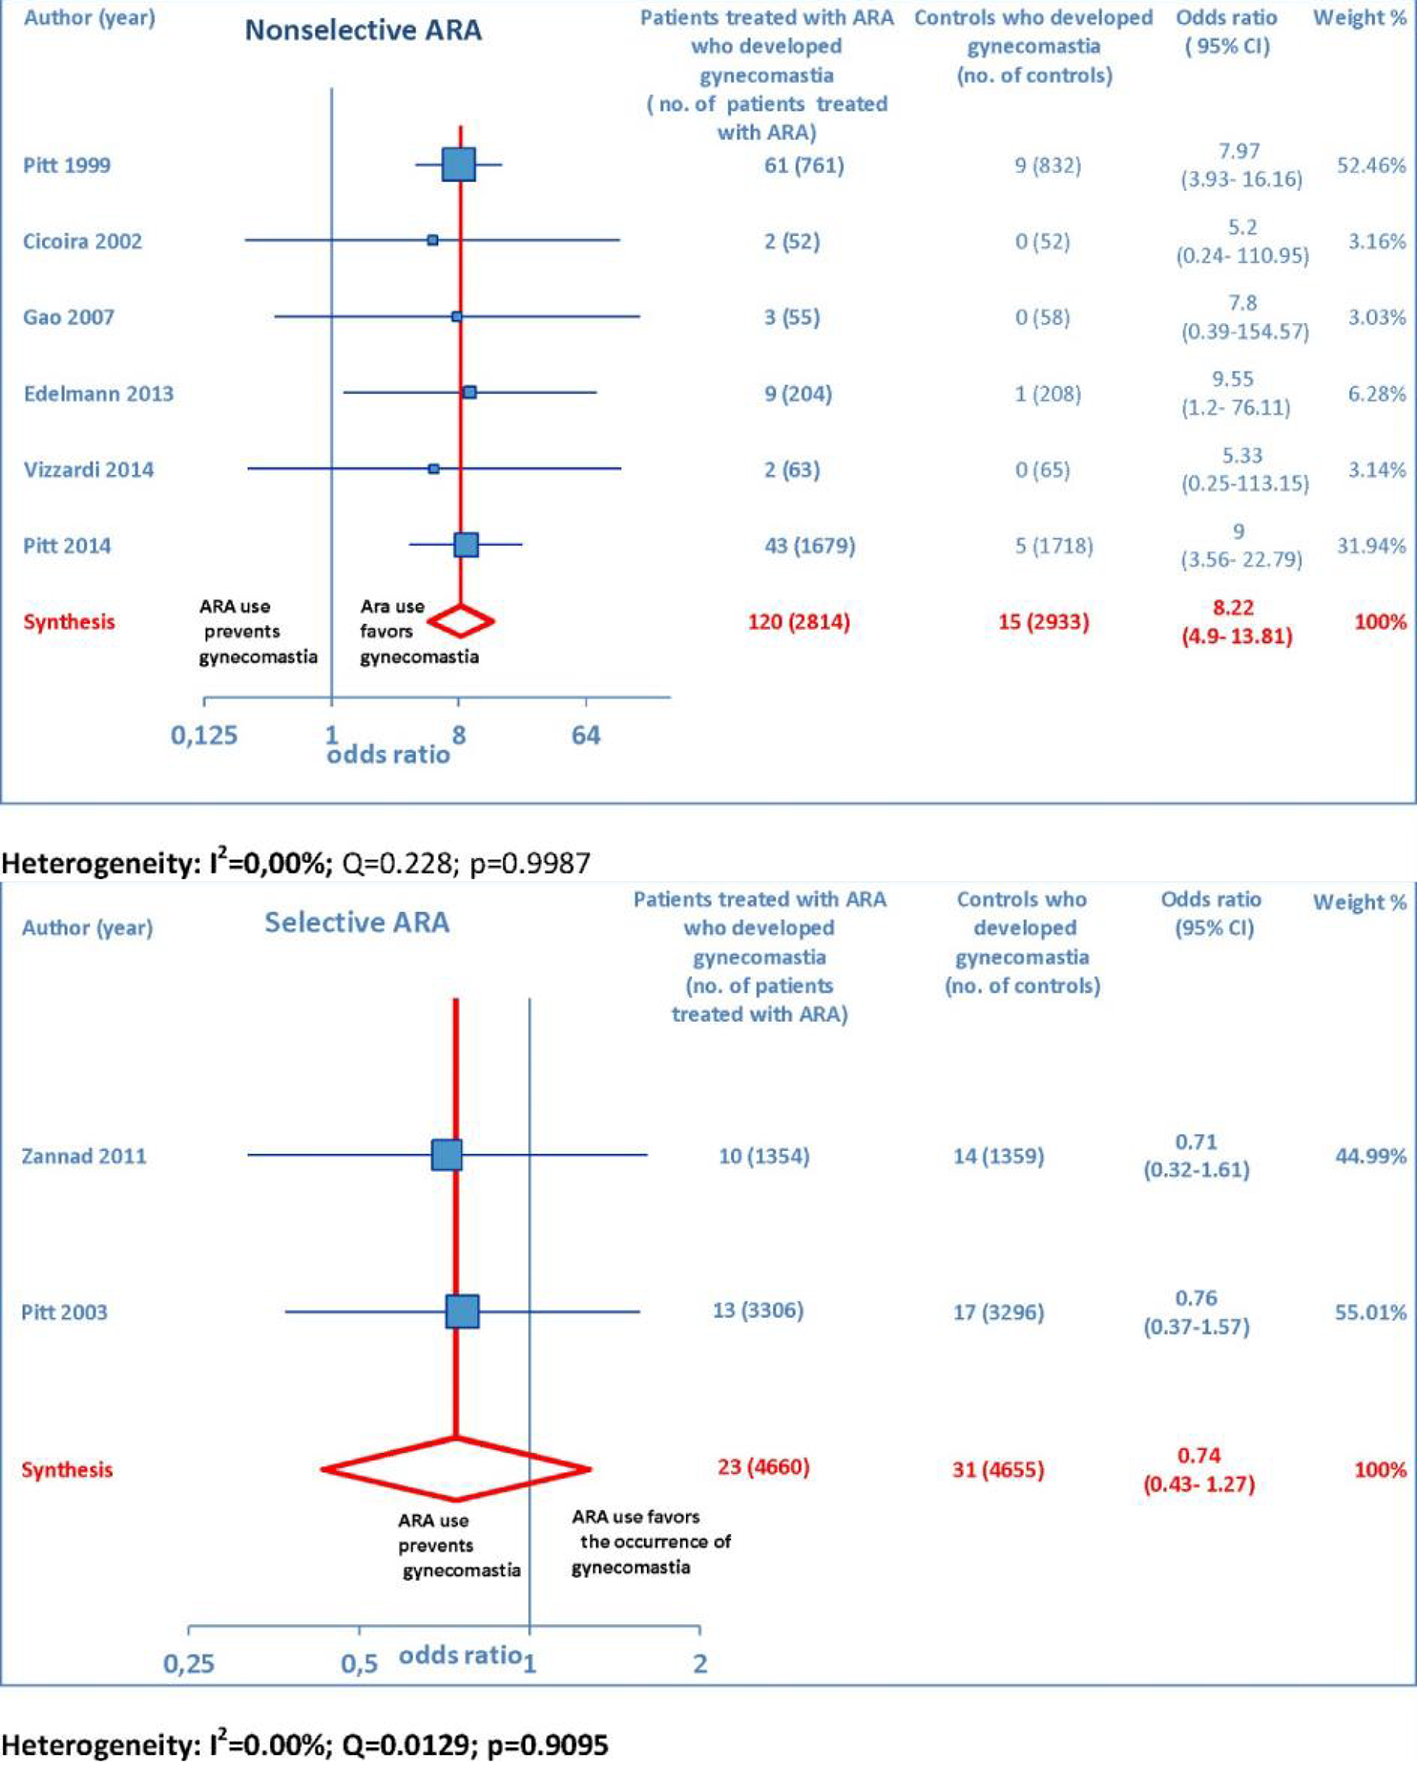
Figure 11. The forest plot of gynecomastia has been subdivided according to ARA type (whether non-selective or selective).