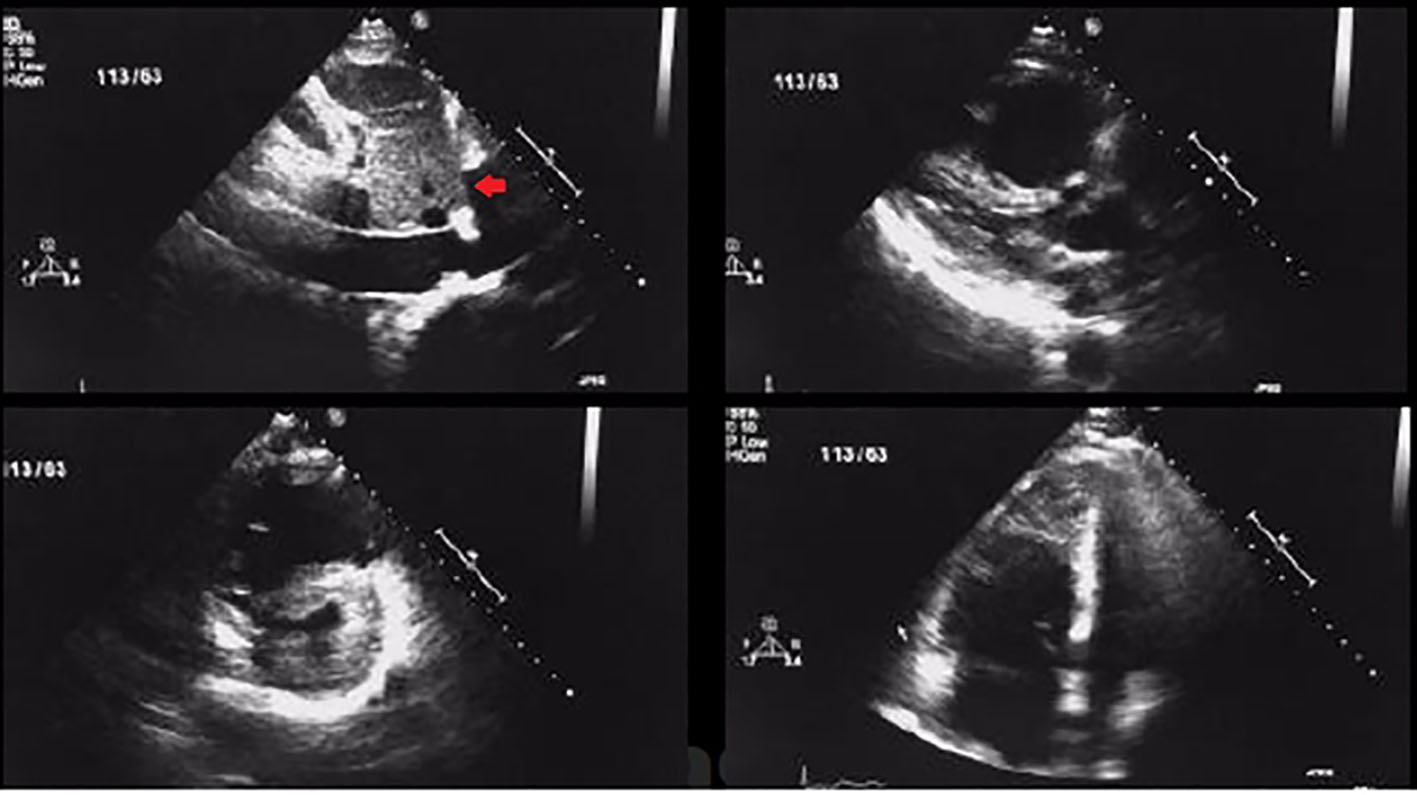
Figure 1. Transthoracic 2D echocardiogram images showing RV dilatation and dysfunction along with thrombus in a patient with acute pulmonary embolism (arrow showing thrombus in short axis view).
| Journal of Clinical Medicine Research, ISSN 1918-3003 print, 1918-3011 online, Open Access |
| Article copyright, the authors; Journal compilation copyright, J Clin Med Res and Elmer Press Inc |
| Journal website http://www.jocmr.org |
Original Article
Volume 9, Number 2, February 2017, pages 163-169
Efficacy and Safety of Thrombolytic Therapy in Acute Submassive Pulmonary Embolism: Follow-Up Study
Figures
Tables
| Variables | Group I (TNK; n = 45) | Group II (placebo; n = 41) | P-value |
|---|---|---|---|
| BMI: body mass index; RR: respiratory rate; SBP: systolic blood pressure; OCP: oral contraceptive pill. | |||
| Age (years) | 54.35 ± 12.1 | 55.12 ± 11.7 | 0.2 |
| Sex (M:F) | 31/14 | 29/12 | 0.4 |
| BMI (kg/m2) | 26.5 ± 4.8 | 27.35 ± 3.7 | 0.13 |
| SBP (mm Hg) | 111 ± 9.79 | 112.1 ± 10.02 | 0.2 |
| Heart rate (beats/min) | 105.2 ± 9.18 | 106.5 ± 8.5 | 0.4 |
| RR (/min) | 18.9 ± 2.67 | 18.95 ± 2.48 | 0.3 |
| Risk factors | |||
| Smoking | 13 (28%) | 12 (29%) | 0.32 |
| Immobilization | 11 (24%) | 11 (26%) | 0.22 |
| Surgery/major trauma in 1 month | 7 (16%) | 6 (14%) | 0.5 |
| Diabetes mellitus | 5 (11%) | 4 (10%) | 0.34 |
| Dyslipidemia | 5 (11%) | 4 (10%) | 0.6 |
| Active malignancy | 1 (2%) | 1 (2.5%) | 0.19 |
| OCP/estrogen use | 0 (0%) | 1 (2.5%) | 0.7 |
| Presenting symptom | |||
| Dyspnea | 35 (79%) | 32 (78%) | 0.11 |
| Chest pain | 25 (56%) | 22 (53%) | 0.32 |
| Syncope | 3 (7%) | 2 (4.8%) | 0.5 |
| Duration of illness (days) | 3.65 ± 2.25 | 3.3 ± 1.83 | 0.6 |
| Variables | Group I (TNK; n = 45) | Group II (placebo; n = 41) | P-value |
|---|---|---|---|
| O2: oxygen; RV: right ventricle; LV: left ventricle; PASP: pulmonary artery systolic pressure; UFH: unfractionated heparin. | |||
| O2 treatment given | 36 (80%) | 30 (75%) | 0.06 |
| RV/LV size ratio | 1.14 ± 0.11 | 1.16 ± 0.14 | 0.08 |
| Troponin T elevation | 34 (75%) | 28 (70%) | 0.2 |
| Troponin I elevation | 25 (55%) | 26 (65%) | 0.4 |
| Either TropT/tropelevation | 45 (100%) | 41 (100%) | 0.5 |
| Baseline mean PASP, mm Hg | 48.90 ± 3.0 | 49.21 ± 3.09 | 0.6 |
| UFH given before randomization | 11 (25%) | 14 (35%) | 0.2 |
| Variables | Group I (TNK; n = 45) | Group II (placebo; n = 41) | P-value |
|---|---|---|---|
| PE: pulmonary embolism; PASP: pulmonary artery systolic pressure; RV: right ventricle. | |||
| Primary composite outcome within 7 days | 2 (4.5%) | 8 (20%) | 0.04 |
| Secondary end points | |||
| All cause death | 2 (4.5%) | 2 (5%) | 0.3 |
| Hemodynamic decompensation | 2 (4.5%) | 8 (20%) | 0.04 |
| Recurrent PE within 7 days | 2 (4.5%) | 1 (2%) | 0.3 |
| Rehospitalization within 30 days | 2 (4.5%) | 4 (10%) | 0.29 |
| Death within 30 days | 2 (4.5%) | 2 (5%) | 0.18 |
| Others | |||
| Mean PASP at D7 (mm Hg) | 32.80 ± 4.02 | 38.13 ± 4.49 | 0.04 |
| Mean ↓ in PASP from baseline (mm Hg) | 14.10 ± 3.95 | 11.08 ± 4.23 | 0.003 |
| Improvement in RV function | 31 (70%) | 16 (40%) | 0.001 |
| Need for mechanical ventilation | 2 (4.5%) | 2 (5%) | 0.6 |
| Mean hospital stay (days) | 8.1 ± 2.51 | 11.1 ± 2.14 | 0.001 |
| Safety end points (bleeding within D7) | |||
| Major bleeding | 1 (2%) | 1 (2%) | 0.45 |
| Minor Bleeding | 7 (16%) | 5 (12%) | 0.04 |
| Hemorrhagic stroke | 1 (2%) | 0 (0%) | 0 |