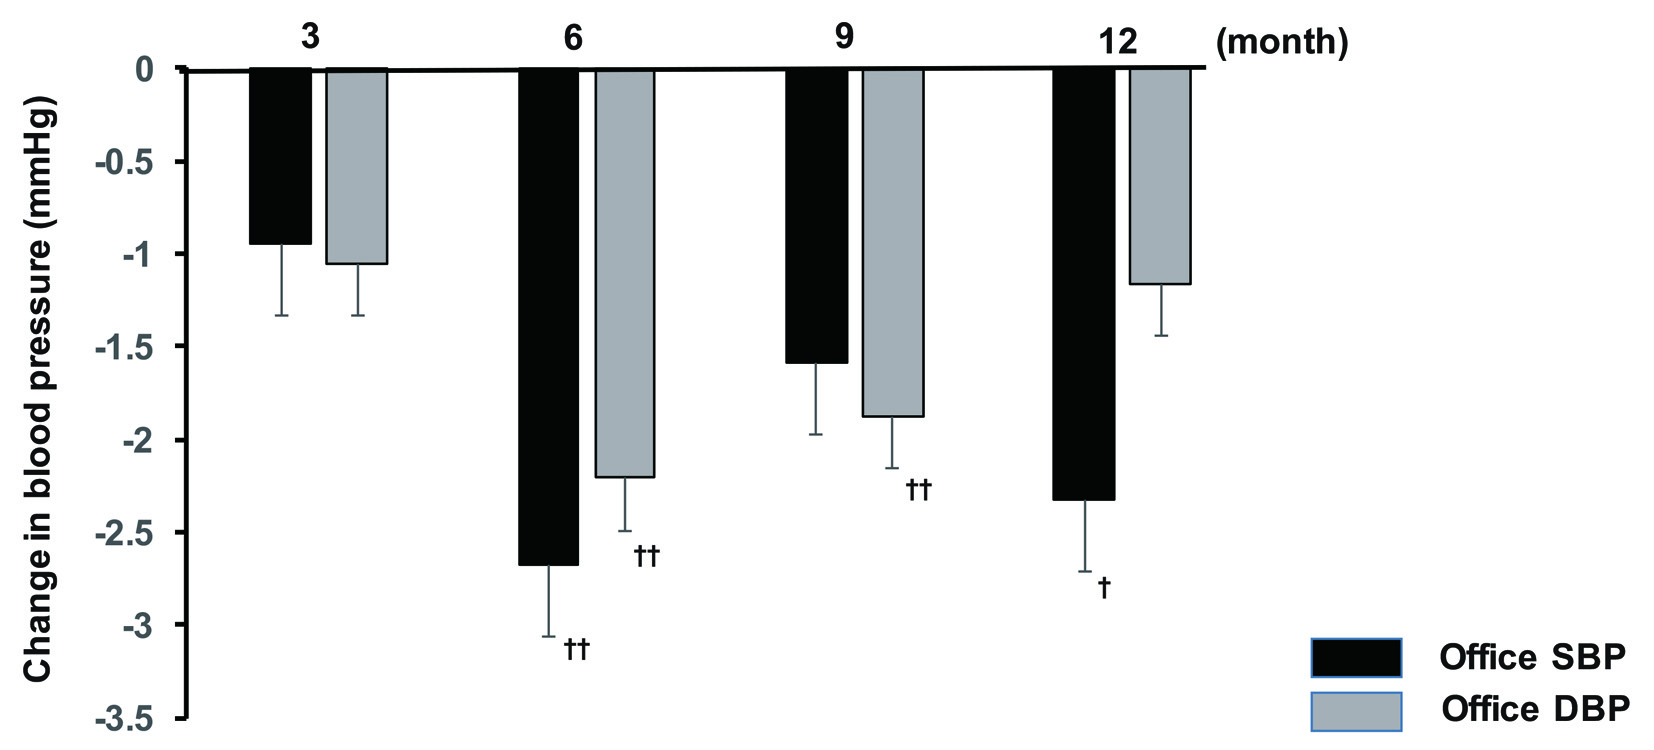
Figure 1. Changes in office BP from baseline to 12 months. †P < 0.05, ††P < 0.01. SBP: systolic blood pressure; DBP: diastolic blood pressure.
| Journal of Clinical Medicine Research, ISSN 1918-3003 print, 1918-3011 online, Open Access |
| Article copyright, the authors; Journal compilation copyright, J Clin Med Res and Elmer Press Inc |
| Journal website http://www.jocmr.org |
Original Article
Volume 9, Number 3, March 2017, pages 188-192
Primary Care-Based Investigation of the Effect of Sitagliptin on Blood Pressure in Hypertensive Patients With Type 2 Diabetes
Figures
Tables
| Baseline | |
|---|---|
| Age, weight, and duration of diabetes: mean ± SD; office BP and home BP: least squares mean ± SE. Office BP: office blood pressure; morning home BP: morning home blood pressure; evening home BP: evening home blood pressure. | |
| Male/female | 251:203 |
| Age (years) | 67.8 ± 11.3 |
| Weight (kg) | 64.9 ± 13.5 |
| Office BP (mm Hg) | |
| SBP | 132.98 ± 0.74 |
| DBP | 75.38 ± 0.49 |
| Morning home BP (mm Hg) | |
| SBP | 129.27 ± 1.12 |
| DBP | 74.49 ± 0.99 |
| Evening home BP (mm Hg) | |
| SBP | 127.15 ± 1.39 |
| DBP | 71.88 ± 1.06 |
| Duration of diabetes (years) | 8.9 ± 7.2 |
| Smoking history, n (%) | 97 (21.4) |
| Drinking history, n (%) | 148 (32.6) |
| Hypertension, n (%) | 330 (72.7) |
| Dyslipidemia, n (%) | 320 (70.5) |
| Cerebrovascular accident, n (%) | 44 (9.7) |
| Myocardial infarction, n (%) | 18 (4.0) |
| Angina, n (%) | 41 (9.0) |
| Peripheral arterial disease, n (%) | 13 (2.9) |
| Retinopathy, n (%) | 31 (6.8) |
| Nephropathy, n (%) | 72 (15.9) |
| Neuropathy, n (%) | 35 (7.7) |
| Baseline | 3 months | 6 months | 9 months | 12 months | |
|---|---|---|---|---|---|
| ANOVA vs. baseline, **P < 0.01; *P < 0.05. Least squares mean ± SE. Data on triglycerides and UACR were subjected to logarithmic transformation. HbA1c: hemoglobin A1c; FPG: fasting plasma glucose; PPG: postprandial plasma glucose; BMI: body mass index; TC: total cholesterol; LDL-C: low-density lipoprotein cholesterol; HDL-C: high-density lipoprotein cholesterol; eGFR: estimated glomerular filtration rate; UACR: urinary albumin/creatinine ratio. | |||||
| HbA1c (%) | 7.31 ± 0.06 | 6.74 ± 0.05** | 6.51 ± 0.05** | 6.48 ± 0.05** | 6.50 ± 0.05** |
| FPG (mg/dL) | 150.75 ± 3.35 | 127.68 ± 2.73** | 126.14 ± 2.35** | 126.97 ± 2.70** | 125.88 ± 2.31** |
| PPG (mg/dL) | 188.98 ± 5.07 | 160.23 ± 4.05** | 158.92 ± 4.35** | 162.66 ± 4.31** | 150.85 ± 3.60** |
| BMI (kg/m2) | 25.15 ± 0.20 | 25.11 ± 0.20 | 25.08 ± 0.20 | 25.08 ± 0.20 | 25.07 ± 0.20 |
| TC (mg/dL) | 200.12 ± 2.39 | 192.82 ± 2.40** | 191.77 ± 2.47** | 191.73 ± 2.22** | 191.92 ± 2.40** |
| LDL-C (mg/dL) | 116.77 ± 1.70 | 112.00 ± 1.58** | 110.94 ± 1.49** | 111.04 ± 1.55** | 110.85 ± 1.48** |
| HDL-C (mg/dL) | 57.37 ± 0.78 | 56.13 ± 0.75* | 56.32 ± 0.74 | 55.87 ± 0.72* | 56.00 ± 0.74* |
| Triglycerides (mg/dL) | 4.95 ± 0.03 | 4.84 ± 0.03** | 4.86 ± 0.03** | 4.87 ± 0.03** | 4.85 ± 0.03** |
| Creatinine (mg/dL) | 0.75 ± 0.01 | 0.76 ± 0.01* | 0.77 ± 0.01** | 0.78 ± 0.01** | 0.78 ± 0.01** |
| eGFR (mL/min/1.73 m2) | 75.45 ± 0.96 | 74.03 ± 1.04 | 73.05 ± 0.94** | 72.56 ± 0.93** | 71.91 ± 0.94** |
| UACR (mg/gCr) | 3.02 ± 0.11 | 2.83 ± 0.12 | 2.80 ± 0.12 | 2.82 ± 0.11* | 2.72 ± 0.13* |