Journal of Clinical Medicine Research, ISSN 1918-3003 print, 1918-3011 online, Open Access
Article copyright, the authors; Journal compilation copyright, J Clin Med Res and Elmer Press Inc
Journal website http://www.jocmr.org

Original Article

Volume 9, Number 5, May 2017, pages 403-409


The Effect of Tofogliflozin Treatment on Postprandial Glucose and Lipid Metabolism in Japanese Men With Type 2 Diabetes: A Pilot Study

Figure

Figure 1.
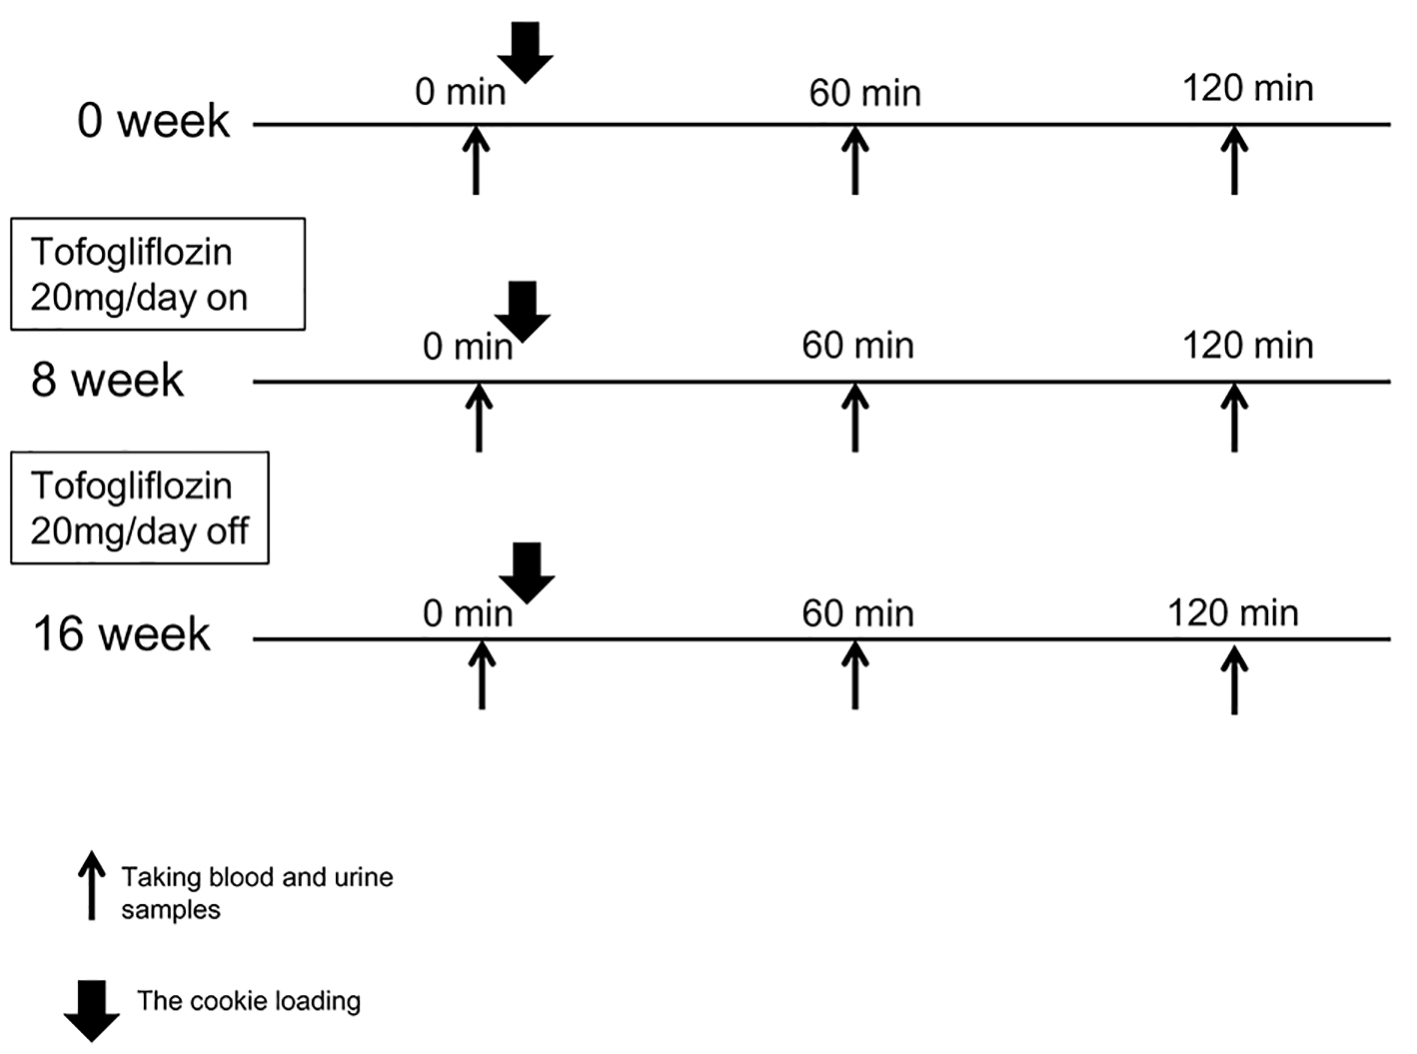
Figure 1. The study protocol is shown. We conducted the cookies tolerance test on three points: 0 week (baseline), 8 weeks (after treatment) and 16 weeks (after washout). Tofogliflozin (20 mg per day) administration started from the next day of the first cookies tolerance test and continued for 8 weeks. After 8 weeks of tofogliflozin administration and a subsequent 8-week washout of the agent, the cookies tolerance test was again conducted exactly the same way it was done before starting tofogliflozin.

Tables

Table 1. Changes in Fasting and Postprandial Glycemic Control, Blood Pressure and Other Metabolic Parameter During the Study Period
 
0 week8 weeks16 weeks0→80→16
BaselineAfter treatmentAfter washout
Mean (median)SEMMean (median)SEMMean (median)SEMChangesSEMP-valueChangesSEMP-value
Data are presented as mean ± SEM unless otherwise noted. *Date are presented as median (first and third quartile) when they are skewed. Homeostasis model assessment-insulin resistance was calculated as fasting insulin × fasting plasma glucose/405; CPR index was calculated by CPR × 100/plasma glucose. CPR: C-peptide immunoreactivity; IRG: immunoreactive glucagon; AUC: the area under the curve.
Age, years60.92.8
Body weight , kg75.44.173.04.274.04.7-2.370.430.00-1.390.950.18
Body mass index, kg/m226.71.125.81.226.11.3-0.8270.160.00-0.510.330.16
Waist circumference, cm91.73.089.33.090.33.8-2.40.700.01-1.371.140.26
Systolic blood pressure, mm Hg139.94.5133.53.8136.35.9-6.43.360.09-3.603.280.30
Diastolic blood pressure, mm Hg83.41.980.51.782.33.1-2.91.650.11-1.102.640.69
Plasma glucose_0 min, mg/dL140.816.2111.87.9124.58.8-29.014.660.08-16.3017.880.39
Plasma glucose_60 min, mg/dL234.419.4203.819.0222.622.5-30.612.670.04-11.8014.150.43
Plasma glucose_120 min, mg/dL218.422.5184.320.1207.725.4-34.115.340.05-10.7012.050.40
Insulin_0 min*, μU/mL5.64.37.23.72.77.75.63.68.2-1.655-3.612.110.38-0.38-1.261.40.92
Insulin_60 min*, μU/mL30.91747.524.317.935.324.821.035.5-6.235-14.582.880.13-4.15-14.304.20.23
Insulin_120 min*, μU/mL19.216.939.420.815.328.923.618.843.1-3.7-17.852.780.23-0.15-8.035.90.87
HOMA-IR*1.71.52.210.72.11.61.22.8-0.78-1.140.010.13-0.19-0.490.61.00
CPR_0 min*, ng/mL1.81.52.21.61.12.91.81.62.1-0.23-0.420.310.380.13-0.340.30.92
CPR_60 min*, ng/mL4.64.06.44.73.96.14.54.05.5-0.25-0.970.270.3-0.23-1.130.20.43
CPR_120 min*, ng/mL6.15.07.36.14.77.05.84.87.0-0.17-2.100.940.38-0.16-0.940.20.49
CPR index*1.41.01.61.60.92.51.31.12.00.105-0.180.590.430.05-0.090.40.33
IRG_0 min, pg/mL160.15.9172.47.1149.07.312.36.470.09-11.106.480.12
IRG_60 min, pg/mL166.15.0180.16.8147.47.814.04.890.02-18.706.030.01
IRG_120 min, pg/mL159.64.8169.77.1147.86.310.15.810.12-11.806.210.09
HbA1c (NGSP, %)6.80.26.50.26.90.3-0.30.100.010.050.190.79
AUC plasma glucose24,840.02,213.921,111.01,911.323,322.02,305.1-3,729.01,461.40.03-1,518.001,583.420.36
AUC insulin3,325.6752.12,454.5361.63,055.7618.5-871.05462.180.09-269.94214.570.24
AUC CPR597.381.2546.352.0562.873.4-51.040.850.24-34.4420.660.13
AUC glucagon19,557.0521.021,069.0747.217,748.0831.71,512.0509.830.02-1,809.00669.030.02


Table 2. Changes in Fasting and Postprandial Lipids During the Study Period
 
0 week8 weeks16 weeks0→80→16
BaselineAfter treatmentAfter washout
Mean (median)SEMMean (median)SEMMean (median)SEMChangesSEMP-valueChangesSEMP-value
Data are presented as mean ± SEM unless otherwise noted. *Date are presented as median (first and third quartile) when they are skewed. RLP-C: remnant-like particles-cholesterol; AUC: the area under the curve.
Total cholesterol, mg/dL179.17.8178.36.381788.7-0.84.820.87-1.15.00.83
HDL-cholesterol, mg/dL51.83.853.84.6457.85.02.02.180.386.02.00.02
LDL-cholesterol, mg/dL101.38.0105.14.29101.36.13.85.670.520.04.21.00
Triglycerides_0 min*, mg/dL94.568.8171.0085.568.00138.0092.569.0115.50-20.5-56.0018.50.27-4.5-84.59.750.38
Triglycerides_60 min*, mg/dL134.5115.0188.7512992.50182.25122.0101.8198.00-9.5-54.0016.250.34-15.0-56.331.000.41
Triglycerides_120 min*, mg/dL178.5131.0230.75156.5110.50197.25155.0114.5239.75-28.5-66.7512.250.06-7.0-64.528.750.59
RLP-C_0 min, mg/dL8.254.303.940.493.870.8-4.314.30.34-4.383.60.26
RLP-C_120 min, mg/dL10.593.96.210.676.731.1-4.383.640.26-3.863.80.34
Lipoprotein lipase mass_0 min, ng/mL37.63.737.14.3044.24.8-0.52.120.826.62.80.04
Lipoprotein lipase mass_120 min, ng/mL37.04.037.44.6943.14.80.41.140.736.12.10.02
Apolipoprotein B48_0 min, ng/mL4.411.63.890.664.080.9-0.521.420.72-0.330.80.69
Apolipoprotein B48_120 min, ng/mL9.431.98.751.089.081.6-0.681.250.6-0.351.50.82
AUC triglycerides24,546.08,149.116,416.02,016.517,010.02,295.8-8,130.07,196.20.29-7,536.06,725.60.29


Table 3. Changes in Other Clinical Parameters During the Study Period
 
0 week8 weeks16 weeks0→80→16
BaselineAfter treatmentAfter washout
Mean (median)SEMMean (median)SEMMean (median)SEMChangesSEMP-valueChangesSEMP-value
Data are presented as mean ± SEM unless otherwise noted. *Date are presented as median (first and third quartile) when they are skewed.
AST, IU/L25.12.223.82.1922.91.9-1.31.680.46-2.21.70.24
ALT, IU/L30.23.427.11.8627.11.5-3.12.470.24-3.12.70.28
Uric acid, mg/dL5.380.44.610.415.250.5-0.770.190.00-0.130.20.60
Na, mEq/L140.20.5140.40.48140.80.30.20.590.740.60.50.28
K, mEq/L4.820.15.390.165.130.10.570.180.010.310.20.08
WBC, /μL5,930583.75,650525.626,020686.7-280438.380.5490277.90.75
RBC, /μL480.413.8510.310.28492.211.329.97.050.0011.84.00.02
Hb, g/dL15.080.416.140.3115.820.61.060.210.000.740.60.24
Ht, %43.921.146.840.8345.391.02.920.710.001.470.30.00
120 Ccr176.57714.3154.44912.65165.02817.7-22.12810.830.07-11.54914.70.45
uAlb/Cr, mg/gCRE0.21440.10.5500.2420.5750.3240.3360.1650.0730.3610.30.25
HMW adiponectin*, μg/mL1.981.353.302.5351.564.082.661.274.250.4750.150.910.000.205-0.11.250.19
8-OHdG/Cre*, ng/mgCRE0.0970.080.130.1180.090.140.0840.080.110.0190.000.040.16-0.005-0.0270.000.13
8-OHdG, ng/mL15.452.412.62.312.491.7-2.852.80.34-2.961.60.10