Journal of Clinical Medicine Research, ISSN 1918-3003 print, 1918-3011 online, Open Access
Article copyright, the authors; Journal compilation copyright, J Clin Med Res and Elmer Press Inc
Journal website http://www.jocmr.org

Original Article

Volume 9, Number 2, February 2017, pages 124-129


Evaluation of Radiation Dose Received by Premature Neonates Admitted to Neonatal Intensive Care Unit

Figures

Figure 1.
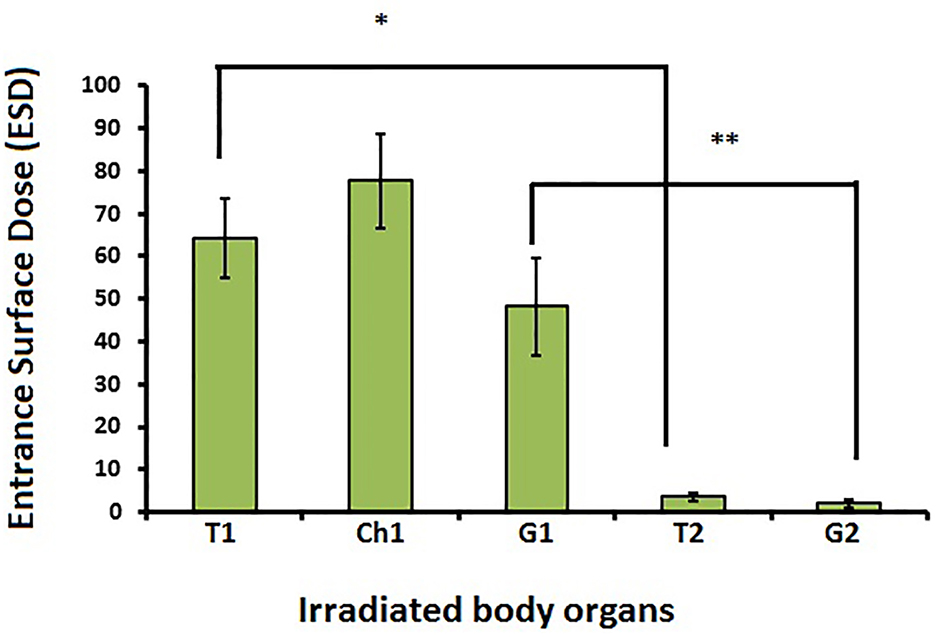
Figure 1. Comparison between mean ESD (mSv) in different infant’s body organs. T1: thyroid of first newborn; Ch1: chest of first new born; G1: gonad of first newborn; T2: thyroid of second newborn; G2: gonad of second newborn. *Comparison of ESD between T1 and T2 (P < 0.001). **Comparison of ESD between G1 and G2 (P < 0.001).
Figure 2.
Figure 2. Comparison between mean ESD (mSv) in different organs (chest, gonad, and thyroid) of first newborn according to newborn’s weight groups (less than 1,500 g, between 1,500 and 2,500 g and more than 2,500 g). The average received dose by all three organs reduced by increasing the infant’s weight.

Tables

Table 1. Demographic and Mean Received Dose by Different Organs in Study’s Premature
 
VariableMean ± SD or n (%)Min. - Max.
T1: thyroid of first newborn; Ch1: chest of first new born; G1: gonad of first newborn; T2: thyroid of second newborn; G2: gonad of second newborn.
Male34 (29.3)-
Female82 (70.7)-
Gestational age (weeks)31.9 ± 2.326.0 - 36.0
Newborn’s weight (g)1950.78 ± 484.9800 - 3100
Newborn’s height (cm)43.60 ± 3.734 - 50
Number of graphs
  158 (50.0)-
  254 (46.6)-
  34 (3.4)-
Distance between TLD and radiography film (cm)5.28 ± 0.433.5 - 6.0
Voltage (kVp)41.60 ± 1.734 - 48
Distance (cm)98.36 ± 2.5390 - 100
T1 (mSv)0.06 ± 0.010.000 - 0.084
Ch1 (mSv)0.08 ± 0.010.046 - 0.111
G1(mSv)0.05 ± 0.010.016 - 0.07
T2 (mSv)0.003 ± 0.0010.002 - 0.007
G2 (mSv)0.002 ± 0.00090.005 - 0.01


Table 2. The Pearson’s Correlation Between the Variables of the Pregnancy Age at Birth and Baby’s Weight With the Amount of Radiation Dose Received in Premature Infants Under Study
 
VariableT1Ch1G1T2G2
T1: thyroid of first newborn; Ch1: chest of first new born; G1: gonad of first newborn; T2: thyroid of second newborn; G2: gonad of second newborn.
Gestational age
  r-0.200-0.424-0.623-0.108-0.196
  P-value0.032< 0.001< 0.0010.2470.035
Newborn’s weight
  r-0.209-0.3610.573-0.101-0.135
  P-value0.024< 0.001< 0.0010.2790.149


Table 3. The Correlation Between Received Dose by T1, Ch1 and G1 With Variables of Gestational Age and Newborn Weight at the Birth Demonstrated by Linear Regression Model
 
Unstandardized coefficientsStandardized coefficients betatP-value
BStd. Error
T1: thyroid of first newborn; Ch1: chest of first newborn; G1: gonad of first newborn; T2: thyroid of second newborn; G2: gonad of second newborn.
T1
  Constant0.1480.023-6.490< 0.001
  Gestational age-0.0030.001-0.544-2.6950.008
  Newborn’s weight-3.638 × 10-70.000-0.016-0.0780.938
Ch1
  Constant0.160.024-6.581< 0.001
  Gestational age-0.0030.001-0.605-2.7650.007
  Newborn’s weight4.462 × 10-60.0000.1970.8990.371
G1
  Constant0.1480.022-6.644< 0.001
  Gestational age-0.0030.001-0.629-3.3190.001
  Newborn’s weight1.783 × 10-70.0000.0070.0390.969