Figures
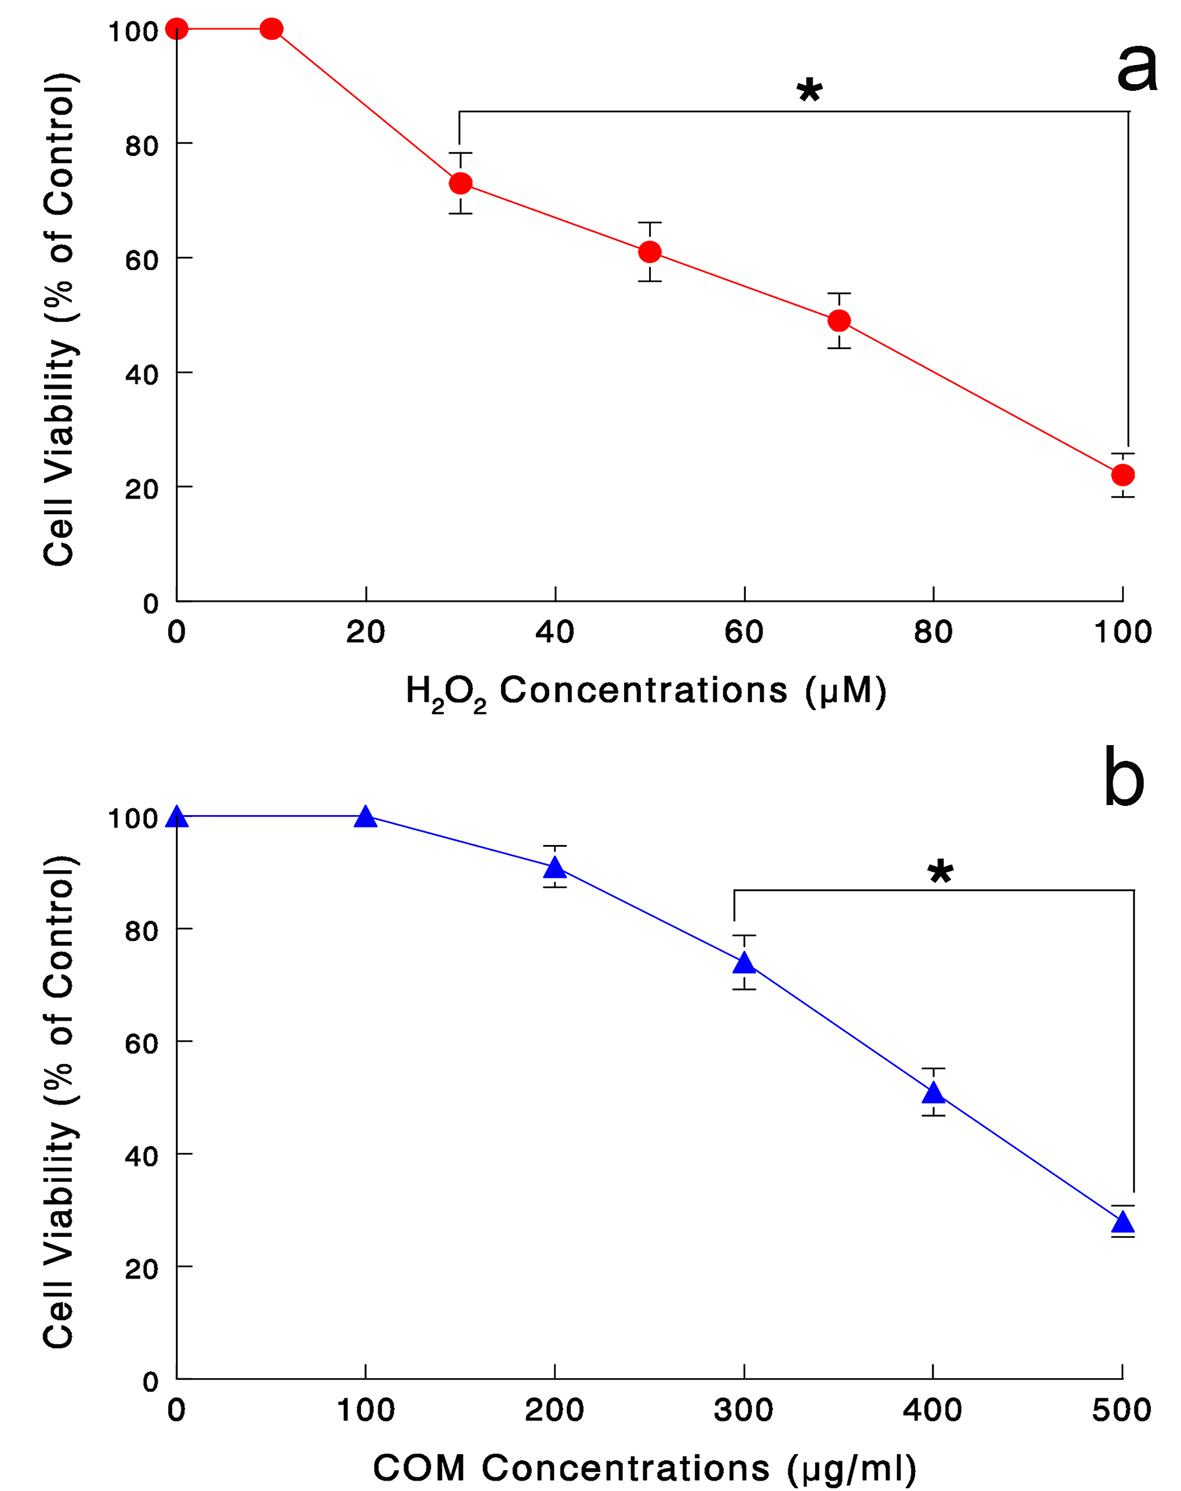
Figure 1. (a) Dose-dependent effects of H2O2 on LLC-PK1 cell viability. Cells were treated with varying concentrations of H2O2 (0 - 100 μM) for 24 h and cell viability was determined by MTT assay. All data are mean ± SD from three independent experiments (*P < 0.05). (b) Dose-dependent effects of COM on cell viability. Cells exposed to varying concentrations of COM (0 - 500 μg/mL) for 6 h were assayed for cell viability. The data are mean ± SD from three separate experiments (*P < 0.05).
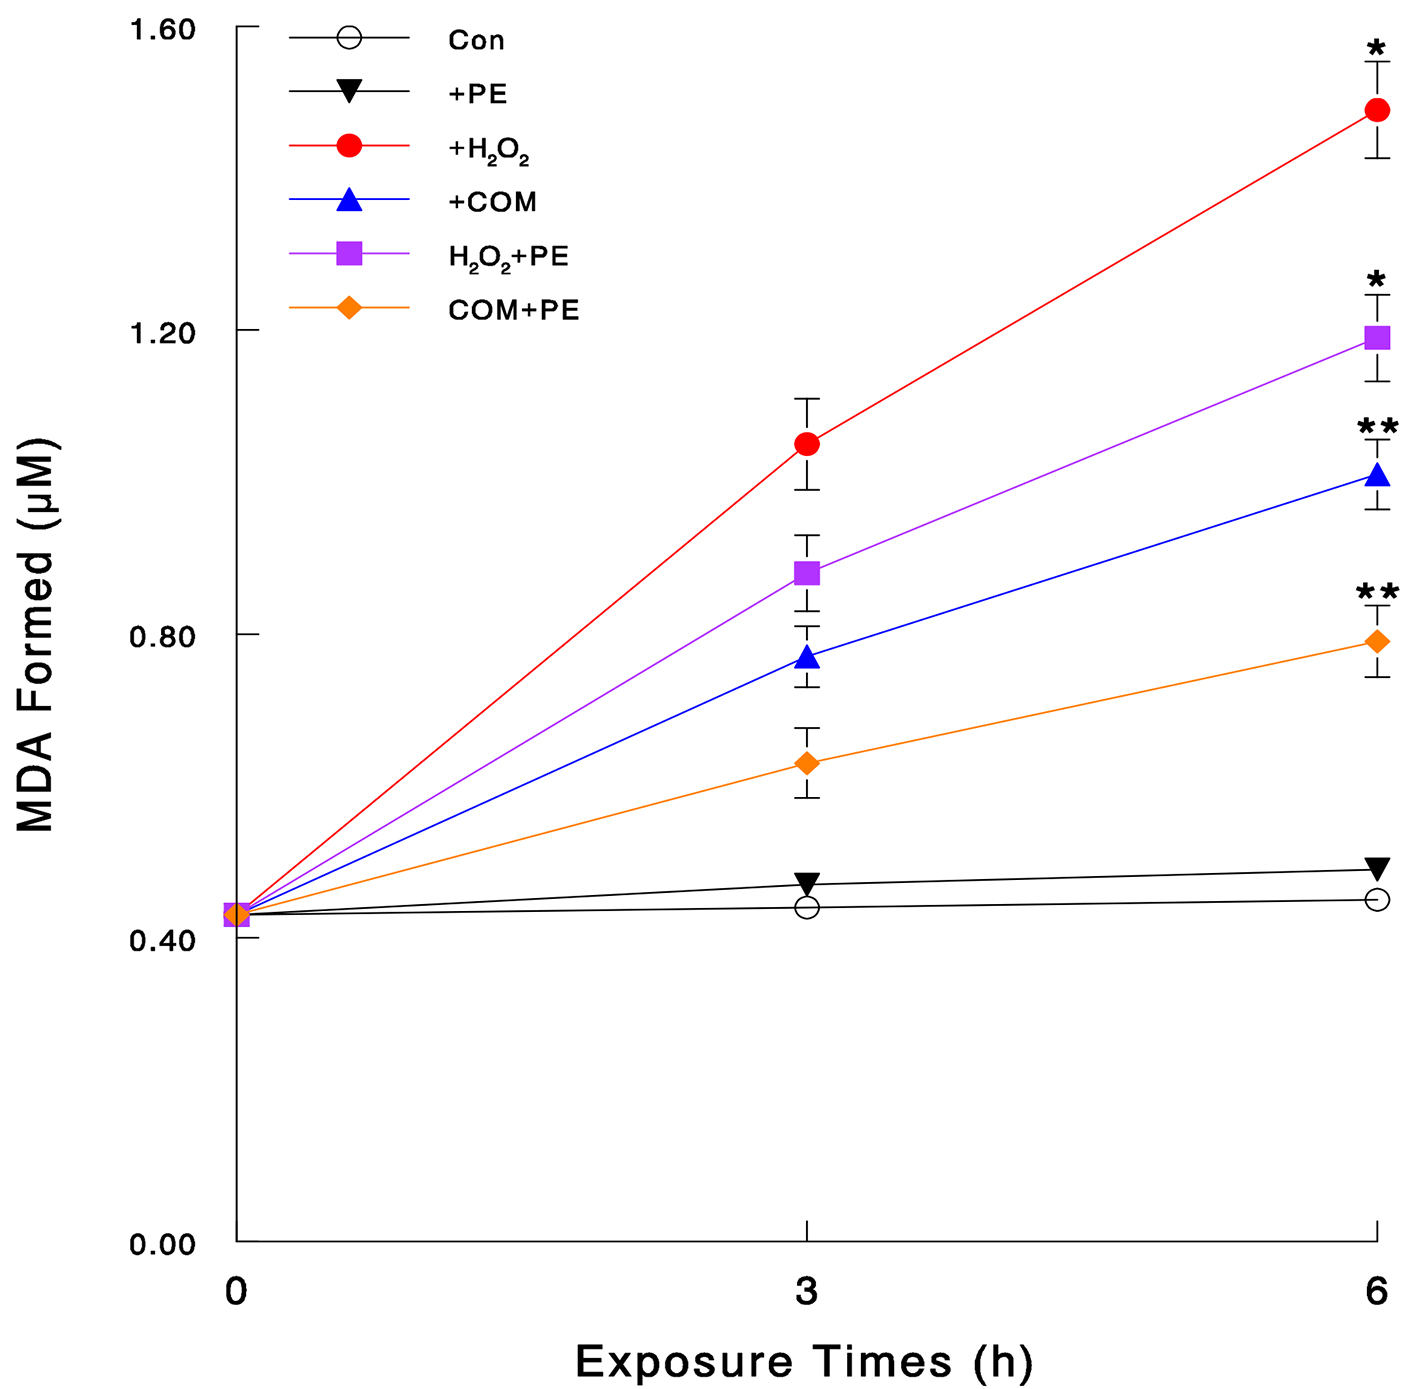
Figure 2. Severity of oxidative stress assessed by LPO assay. Cells were exposed to H2O2 (70 μM), COM (400 μg/mL), PE (50 μg/mL), or PE (50 μg/mL) combined with either H2O2 (70 μM) or COM (400 μg/mL), for 3 or 6 h. The amounts of MDA formed, assessed by LPO assay, were plotted against times. All data are mean ± SD from three separate experiments (*P < 0.03 and **P < 0.05 compared with controls).
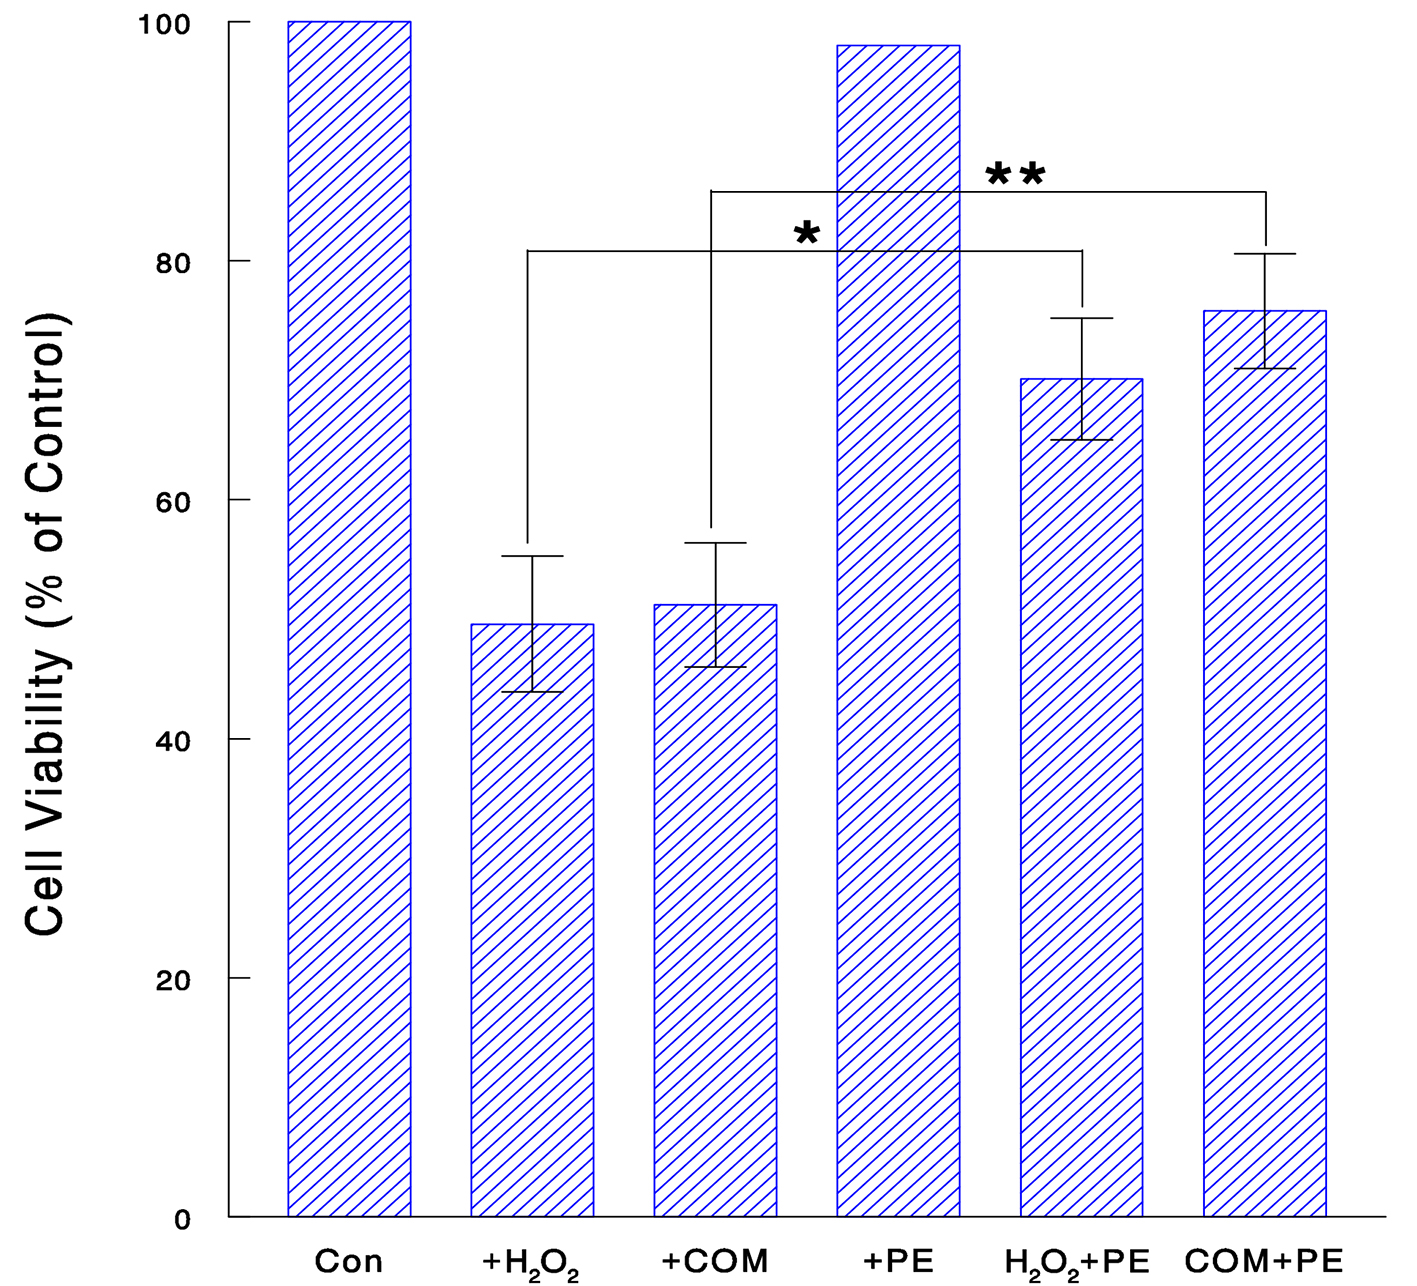
Figure 3. Renoprotective effect of PE against oxidative stress. Cells were treated with H2O2 (70 μM for 24 h), COM (400 μg/mL for 6 h), PE (50 μg/mL for 24 h), or PE combined with H2O2 (for 24 h) or COM (for 6 h). Cell viability was determined and the data are mean ± SD from three independent experiments (*P < 0.05; **P < 0.03).
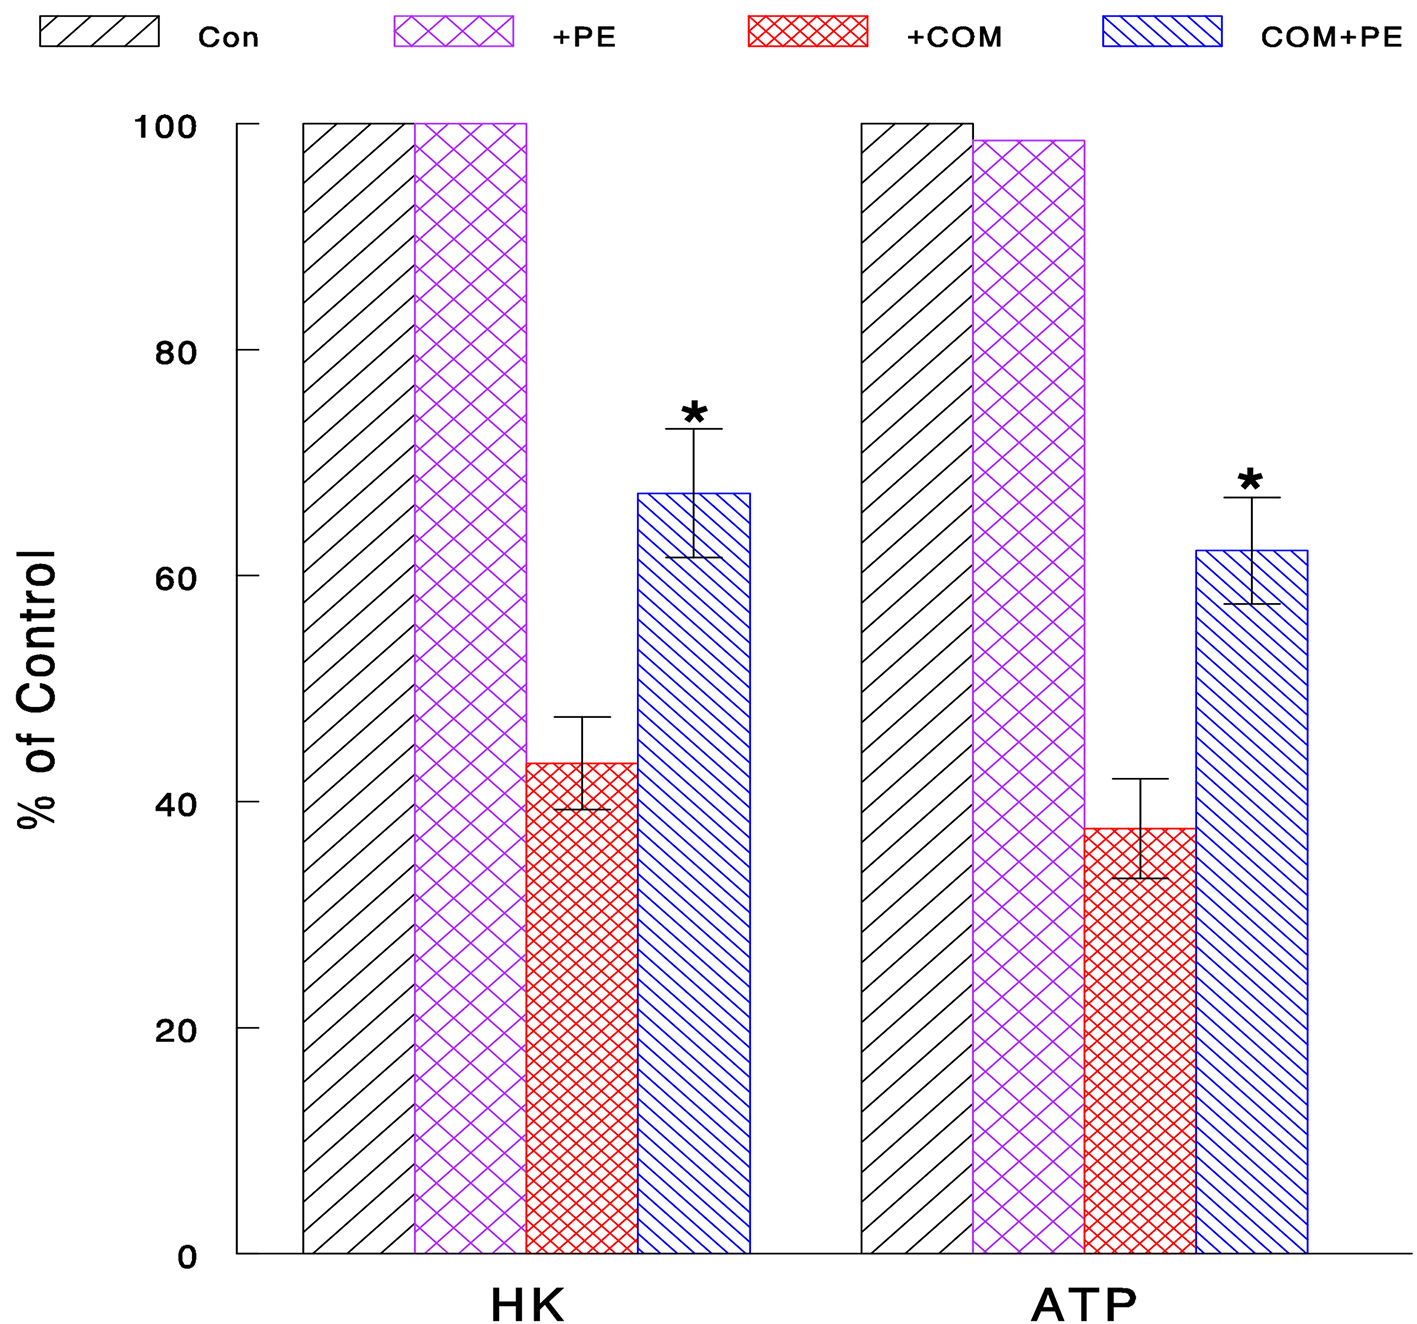
Figure 4. Inhibitory effect of COM on glycolysis and its prevention with PE. Cells exposed to COM (400 μg/mL), PE (50 μg/mL), or PE combined with COM for 6 h were assayed for HK activity and cellular ATP level. All data are mean ± SD from three separate experiments (*P < 0.05 compared with COM-treated cells).
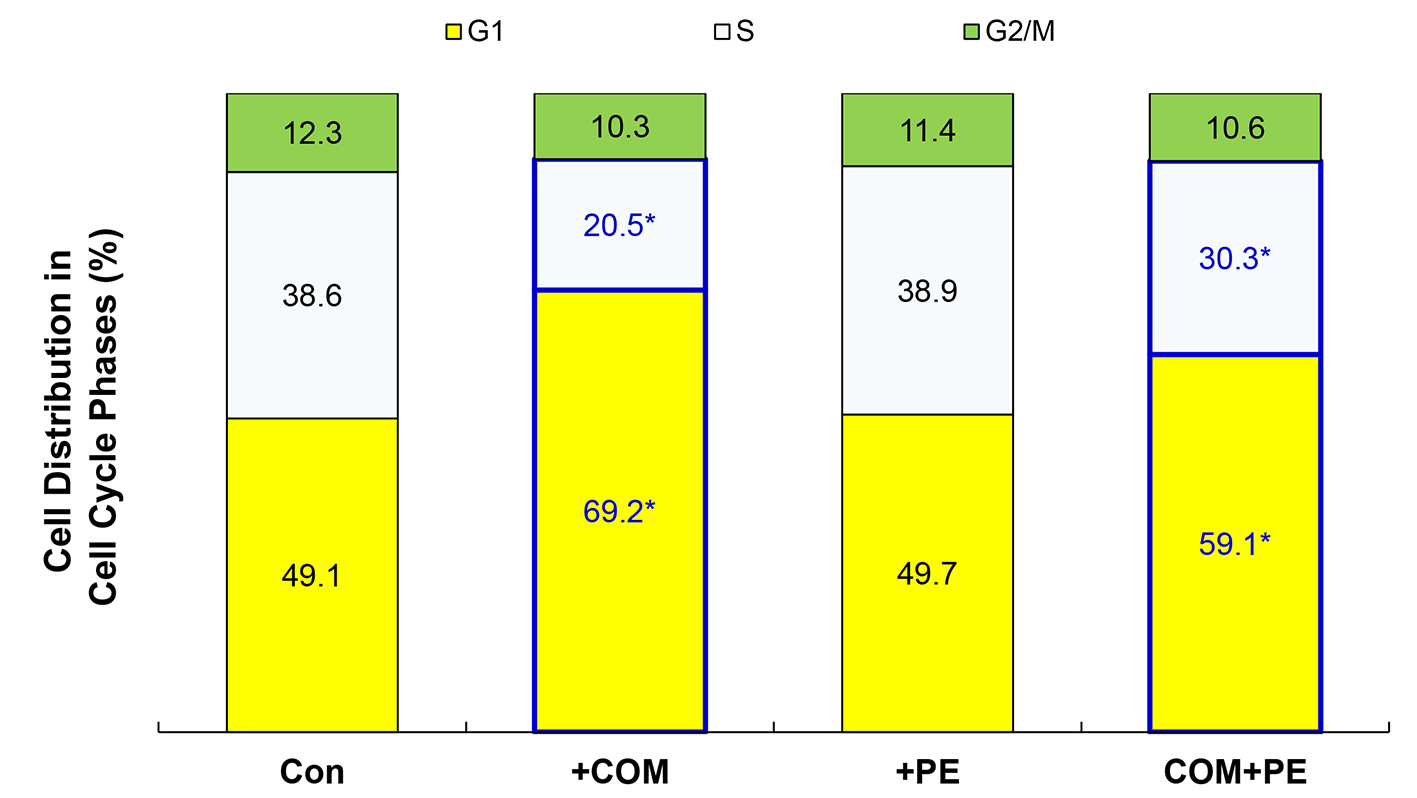
Figure 5. Cell cycle analysis. Cells exposed to COM (400 μg/mL), PE (50 μg/mL), or PE combined with COM for 6 h were subjected to cell cycle analysis. The data are representatives of three independent experiments (*P < 0.05 compared with controls).


