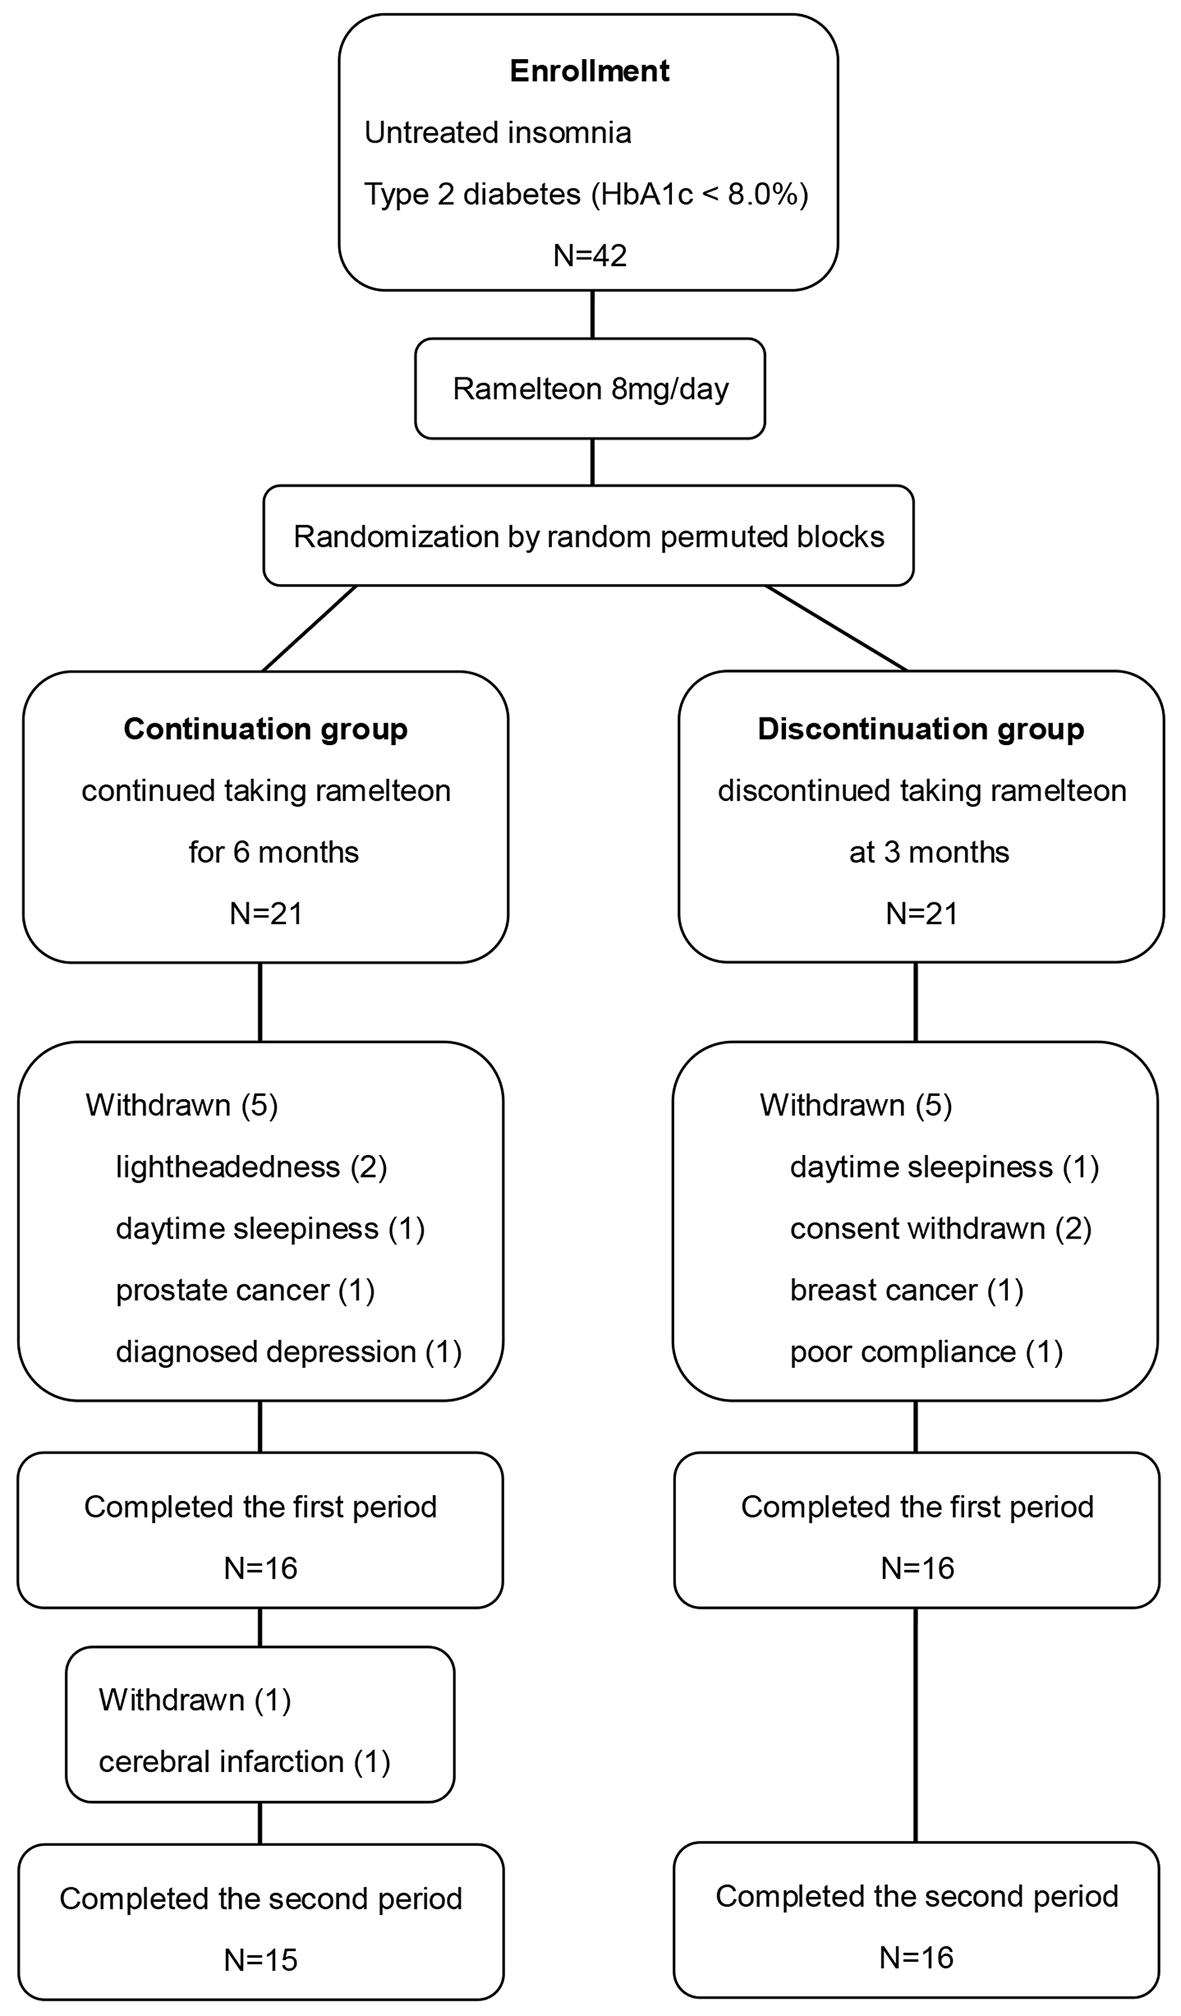
Figure 1. Diagram of patient flow.
| Journal of Clinical Medicine Research, ISSN 1918-3003 print, 1918-3011 online, Open Access |
| Article copyright, the authors; Journal compilation copyright, J Clin Med Res and Elmer Press Inc |
| Journal website http://www.jocmr.org |
Original Article
Volume 8, Number 12, December 2016, pages 878-887
The Effects of Ramelteon on Glucose Metabolism and Sleep Quality in Type 2 Diabetic Patients With Insomnia: A Pilot Prospective Randomized Controlled Trial
Figures
Tables
| Data are expressed as the mean ± SD or number (%). BMI: body mass index. | |
| Age (years) | 68.9 ± 8.1 |
| Gender (male/female) | 17/15 |
| Height (cm) | 162.3 ± 9.3 |
| Body weight (kg) | 68.1 ± 14.5 |
| BMI (kg/m2) | 25.7 ± 4.3 |
| Diabetes duration (years) | 9.8 ± 3.5 |
| HbA1c (%) | 6.7 ± 0.4 |
| Medications | |
| Anti-diabetes (%) | 28 (88) |
| Sulfonylureas (%) | 11 (34) |
| Biguanides (%) | 16 (50) |
| Thiazolidines (%) | 5 (16) |
| Incretin-based drugs (%) | 16 (50) |
| Insulin (%) | 3 (9) |
| Anti-hypertension (%) | 18 (56) |
| Angiotensin II receptor blockers (%) | 15 (47) |
| Calcium channel blockers (%) | 13 (41) |
| β-blockers (%) | 5 (16) |
| Anti-dyslipidemia (%) | 20 (63) |
| Statins (%) | 18 (56) |
| Fibrates (%) | 2 (6) |
| Ethyl icosapentate (%) | 3 (9) |
| Baseline | 3 months | P value | |
|---|---|---|---|
| Data are expressed as the mean ± SD or number (%). BMI: body mass index; GA: glycated albumin; FPG: fasting plasma glucose; IRI: immunoreactive insulin; s-CPR: serum C-peptide immunoreactivity; HOMA-IR: homeostatic model of assessment of insulin resistance; QUICKI: quantitative insulin sensitivity check index; LDL-C: low-density lipoprotein cholesterol; HDL-C: high-density lipoprotein cholesterol; eGFR: estimated glomerular filtration rate; UAE: urinary albumin excretion; hs-CRP: high-sensitivity C-reactive protein; PSQI: Pittsburgh sleep questionnaire index; SF-36: short form 36; PCS: physical component summary; MCS: mental component summary; RCS: role/social component summary. | |||
| Gender (male/female) | 17/15 | ||
| Body weight (kg) | 68.1 ± 14.5 | 68.4 ± 14.4 | |
| BMI (kg/m2) | 25.7 ± 4.3 | 25.8 ± 4.3 | |
| Systolic blood pressure (mm Hg) | 138 ± 21 | 135 ± 20 | |
| Diastolic blood pressure (mm Hg) | 79 ± 11 | 81 ± 11 | |
| HbA1c (%) | 6.7 ± 0.4 | 6.7 ± 0.5 | |
| GA (%) | 17.1 ± 2.6 | 17.2 ± 2.4 | |
| FPG (mg/dL) | 120 ± 18 | 125 ± 23 | |
| IRI (μU/mL) | 8.01 ± 6.80 | 8.01 ± 7.30 | |
| s-CPR (ng/mL) | 2.19 ± 1.23 | 2.12 ± 1.16 | |
| HOMA-IR | 2.08 ± 1.59 | 1.92 ± 1.40 | |
| QUICKI | 0.35 ± 0.04 | 0.35 ± 0.04 | |
| CPR index | 1.84 ± 1.01 | 1.72 ± 0.96 | |
| Total cholesterol (mg/dL) | 177 ± 33 | 171 ± 29 | |
| LDL-C (mg/dL) | 105 ± 27 | 100 ± 24 | 0.048 |
| HDL-C (mg/dL) | 60 ± 17 | 58 ± 15 | |
| LDL-C/HDL-C | 1.9 ± 0.6 | 1.8 ± 0.6 | |
| Triglyceride (mg/dL) | 131 ± 76 | 117 ± 63 | |
| Non-HDL-C (mg/dL) | 117 ± 29 | 112 ± 27 | |
| Cre (mg/dL) | 0.82 ± 0.22 | 0.83 ± 0.23 | |
| eGFR (mL/min) | 65.4 ± 13.4 | 65.6 ± 14.0 | |
| UAE (mg/g.Cre) | 28.6 ± 49.6 | 42.8 ± 87.3 | |
| AST (U/L) | 24 ± 8 | 25 ± 9 | |
| ALT (U/L) | 25 ± 13 | 25 ± 9 | |
| γGTP (U/L) | 30 ± 16 | 30 ± 16 | |
| Ferritin (ng/mL) | 140 ± 149 | 127 ± 102 | |
| hs-CRP (ng/mL) | 1,060 ± 2,358 | 1,383 ± 2,569 | |
| PSQI (0 - 18) | 8.1 ± 4.1 | 7.2 ± 2.8 | 0.030 |
| C1 (0 - 3) | 1.6 ± 0.8 | 1.3 ± 0.7 | 0.010 |
| C2 (0 - 3) | 1.7 ± 2.1 | 1.2 ± 1.8 | 0.040 |
| C3 (0 - 3) | 1.8 ± 1.0 | 1.6 ± 0.9 | |
| C4 (0 - 3) | 0.8 ± 1.0 | 0.8 ± 1.0 | |
| C5 (0 - 3) | 1.0 ± 0.4 | 0.9 ± 0.3 | |
| C7 (0 - 3) | 1.5 ± 1.1 | 1.5 ± 0.8 | |
| Sleep latency (min) | 23.6 ± 25.7 | 18.8 ± 17.6 | 0.039 |
| Total sleep time (h) | 6.1 ± 2.4 | 6.2 ± 2.1 | |
| SF-36 | |||
| PCS (0 - 100) | 47.3 ± 13.5 | 50.1 ± 12.3 | |
| MCS (0 - 100) | 54.1 ± 9.7 | 53.3 ± 8.7 | |
| RCS (0 - 100) | 36.7 ± 10.5 | 38.5 ± 8.6 | |
| Continuation group | Discontinuation group | Inter group in 6 months (P value) | |||||
|---|---|---|---|---|---|---|---|
| 3 months | 6 months | P | 3 months | 6 months | P | ||
| Data are expressed as the mean ± SD or number (%). BMI: body mass index; SBP: systolic blood pressure; DBP: diastolic blood pressure; GA: glycated albumin; FPG: fasting plasma glucose; IRI: immunoreactive insulin; s-CPR: serum C-peptide immunoreactivity; HOMA-IR: homeostatic model of assessment of insulin resistance; QUICKI: quantitative insulin sensitivity check index; TC: total cholesterol; LDL-C: low-density lipoprotein cholesterol; HDL-C: high-density lipoprotein cholesterol; TG: triglyceride; eGFR: estimated glomerular filtration rate; UAE: urinary albumin excretion; hs-CRP: high-sensitivity C-reactive protein; PSQI: Pittsburgh sleep questionnaire index; SF-36: short form 36; PCS: physical component summary; MCS: mental component summary; RCS: role/social component summary. | |||||||
| Age | 68.7 ± 8.2 | 68.8 ± 8.3 | |||||
| Gender (M/F) | 7/8 | 9/7 | |||||
| Body weight (kg) | 69.1 ± 14.6 | 69.5 ± 14.6 | 67.9 ± 15.0 | 67.9 ± 15.0 | |||
| BMI (kg/m2) | 26.1 ± 4.7 | 26.3 ± 4.8 | 25.6 ± 4.1 | 25.6 ± 4.2 | |||
| SBP (mm Hg) | 132 ± 19 | 131 ± 15 | 138 ± 22 | 135 ± 24 | |||
| DBP (mm Hg) | 80 ± 11 | 77 ± 14 | 82 ± 12 | 79 ± 16 | |||
| HbA1c (%) | 6.8 ± 0.6 | 6.8 ± 0.5 | 6.7 ± 0.5 | 6.9 ± 0.6 | 0.003 | 0.047 | |
| GA (%) | 17.1 ± 2.3 | 17.3 ± 2.9 | 17.1 ± 2.7 | 17.6 ± 2.7 | 0.027 | ||
| FPG (mg/dL) | 126 ± 21 | 124 ± 16 | 125 ± 25 | 128 ± 26 | |||
| IRI (μU/mL) | 9.43 ± 9.52 | 11.30 ± 12.30 | 6.9 ± 4.61 | 6.07 ± 3.06 | |||
| sCPR (ng/dL) | 2.41 ± 1.37 | 2.78 ± 1.91 | 1.88 ± 0.93 | 1.62 ± 0.56 | |||
| HOMA-IR | 1.77 ± 1.23 | 2.29 ± 2.41 | 2.14 ± 1.80 | 1.87 ± 0.76 | |||
| QUICKI | 0.35 ± 0.05 | 0.34 ± 0.04 | 0.35 ± 0.03 | 0.36 ± 0.03 | |||
| CPR index | 1.85 ± 0.84 | 2.19 ± 1.35 | 1.63 ± 1.10 | 1.31 ± 0.5 | |||
| TC (mg/dL) | 171 ± 30 | 175 ± 35 | 173 ± 28 | 177 ± 30 | |||
| LDL-C (mg/dL) | 105 ± 26 | 106 ± 31 | 98 ± 20 | 104 ± 23 | |||
| HDL-C (mg/dL) | 55 ± 15 | 58 ± 17 | 61 ± 14 | 61 ± 14 | |||
| LDL-C/HDL-C | 2.0 ± 0.6 | 1.9 ± 0.7 | 1.7 ± 0.5 | 1.8 ± 0.4 | |||
| TG (mg/dL) | 129 ± 65 | 127 ± 59 | 109 ± 62 | 121 ± 63 | |||
| Non-HDL-C (mg/dL) | 116 ± 28 | 117 ± 31 | 112 ± 23 | 116 ± 20 | |||
| Cre (mg/dL) | 0.89 ± 0.29 | 0.87 ± 0.25 | 0.77 ± 0.14 | 0.75 ± 0.16 | |||
| eGFR (mL/min) | 61.3 ± 18.1 | 61.8 ± 17.5 | 68.7 ± 7.6 | 71.3 ± 9.7 | |||
| UAE (mg/g.Cre) | 39.6 ± 70.1 | 32.7 ± 41.4 | 47.6 ± 107.6 | 35.8 ± 51.7 | |||
| AST (U/L) | 26 ± 11 | 24 ± 7 | 23 ± 7 | 24 ± 5 | |||
| ALT (U/L) | 26 ± 8 | 25 ± 9 | 24 ± 10 | 25 ± 9 | |||
| γGTP (U/L) | 32 ± 14 | 32 ± 17 | 28 ± 17 | 28 ± 17 | |||
| Ferritin (ng/mL) | 161 ± 111 | 175 ± 121 | 107 ± 87 | 105 ± 96 | |||
| hs-CRP (ng/mL) | 2,071 ± 3,628 | 1,641 ± 3,957 | 766 ± 733 | 627 ± 648 | |||
| PSQI (0 - 18) | 7.5 ± 3.4 | 7.2 ± 4.0 | 7.2 ± 2.3 | 6.5 ± 3.2 | |||
| C1 (0 - 3) | 1.1 ± 0.5 | 1.1 ± 0.7 | 1.4 ± 0.8 | 1.3 ± 1.0 | |||
| C2 (0 - 3) | 1.4 ± 1.8 | 1.8 ± 2.0 | 1.0 ± 1.8 | 0.8 ± 1.5 | |||
| Sleep latency | 20.9 ± 20.0 | 27.6 ± 27.4 | 15.9 ± 15.6 | 15.3 ± 12.7 | |||
| C3 (0 - 3) | 1.6 ± 0.7 | 1.5 ± 1.1 | 1.7 ± 1.0 | 1.6 ± 1.0 | |||
| C4 (0 - 3) | 1.0 ± 0.9 | 0.7 ± 0.8 | 0.8 ± 1.1 | 0.7 ± 0.9 | |||
| C5 (0 - 3) | 1.0 ± 0.4 | 0.9 ± 0.5 | 0.9 ± 0.3 | 0.9 ± 0.3 | |||
| C7 (0 - 3) | 1.5 ± 1.0 | 1.4 ± 0.9 | 1.4 ± 0.6 | 1.4 ± 0.7 | |||
| SF-36 | |||||||
| PCS (0 - 100) | 52.9 ± 9.7 | 54.0 ± 9.8 | 49.6 ± 13.3 | 48.6 ± 13.3 | |||
| MCS (0 - 100) | 52.4 ± 9.0 | 53.2 ± 7.7 | 53.5 ± 9.7 | 53.8 ± 10.8 | |||
| RCS (0 - 100) | 38.3 ± 7.2 | 39.5 ± 8.6 | 37.6 ± 10.1 | 38.5 ± 10.5 | |||