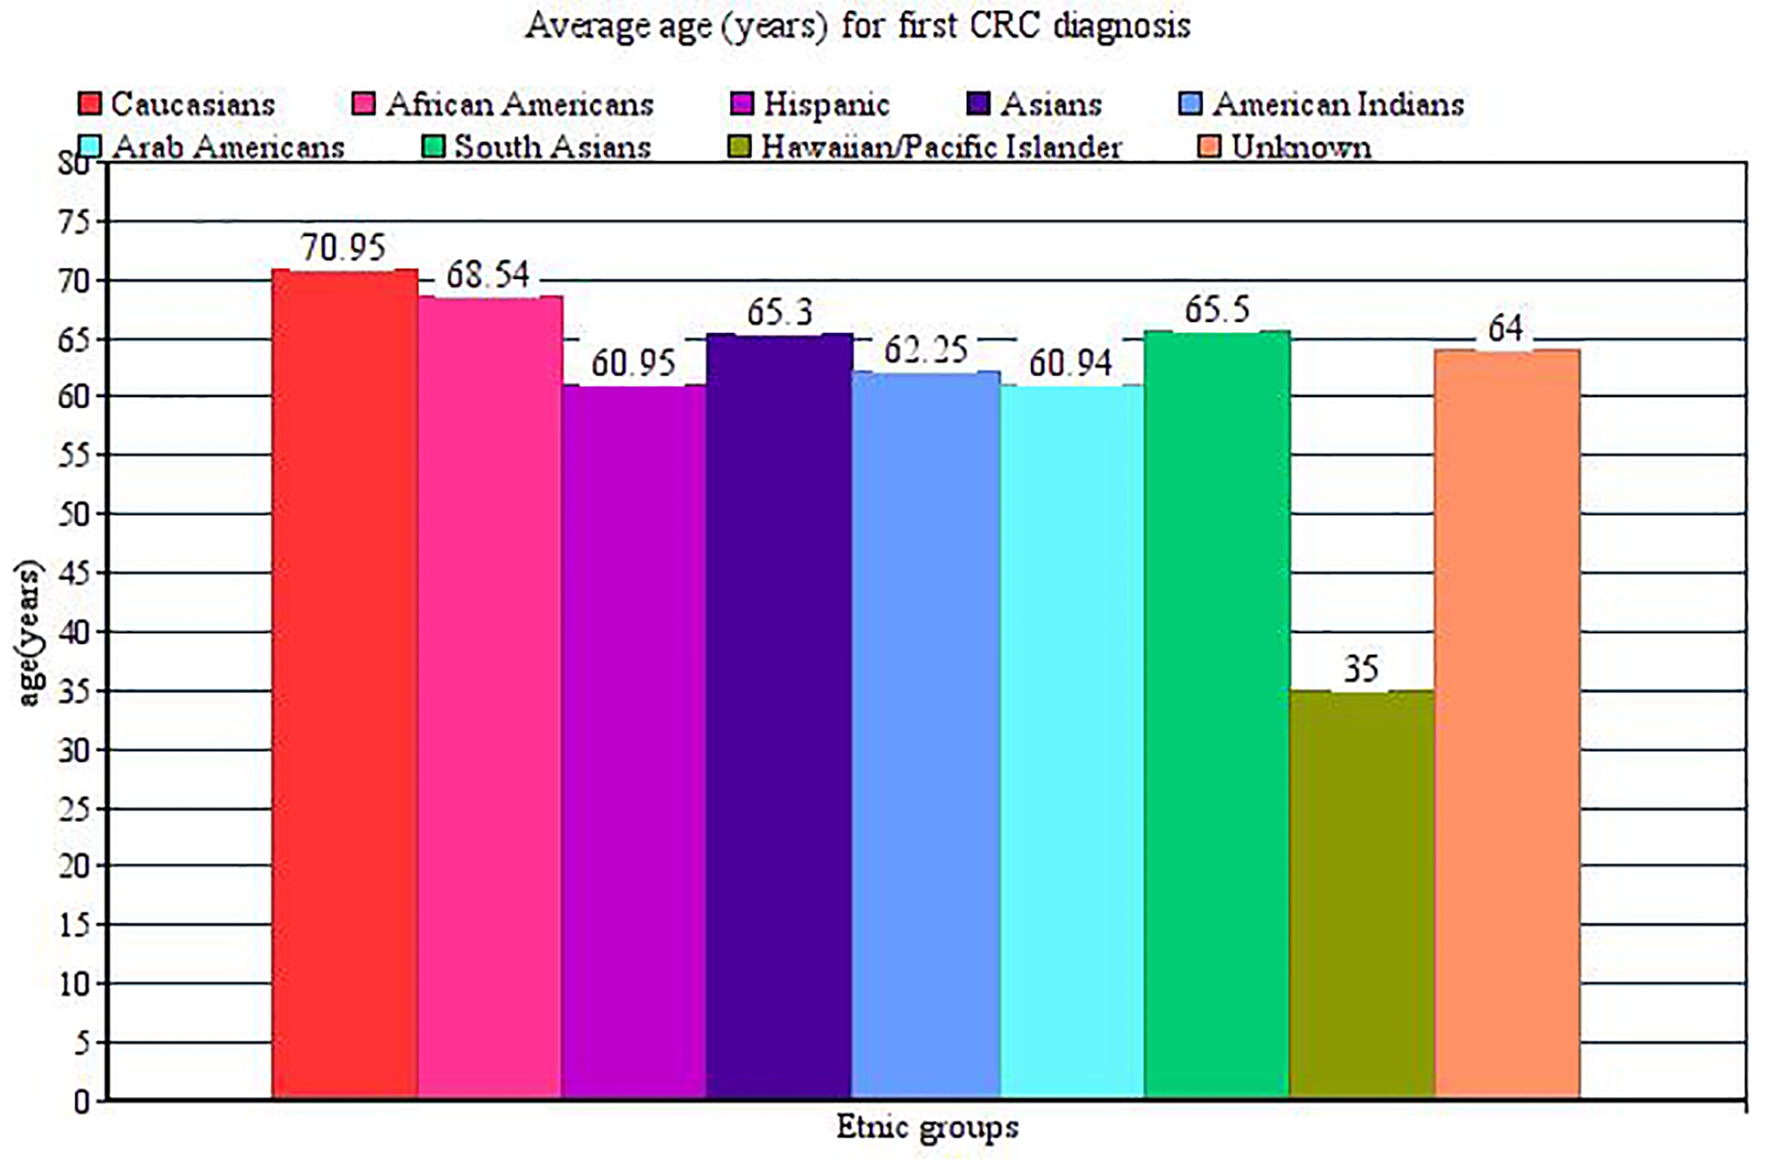
Figure 1. Mean age of CRC presentation for different ethnicities.
| Journal of Clinical Medicine Research, ISSN 1918-3003 print, 1918-3011 online, Open Access |
| Article copyright, the authors; Journal compilation copyright, J Clin Med Res and Elmer Press Inc |
| Journal website http://www.jocmr.org |
Original Article
Volume 8, Number 11, November 2016, pages 777-786
Racial Disparities in Colorectal Carcinoma Incidence, Severity and Survival Times Over 10 Years: A Retrospective Single Center Study
Figures
Tables
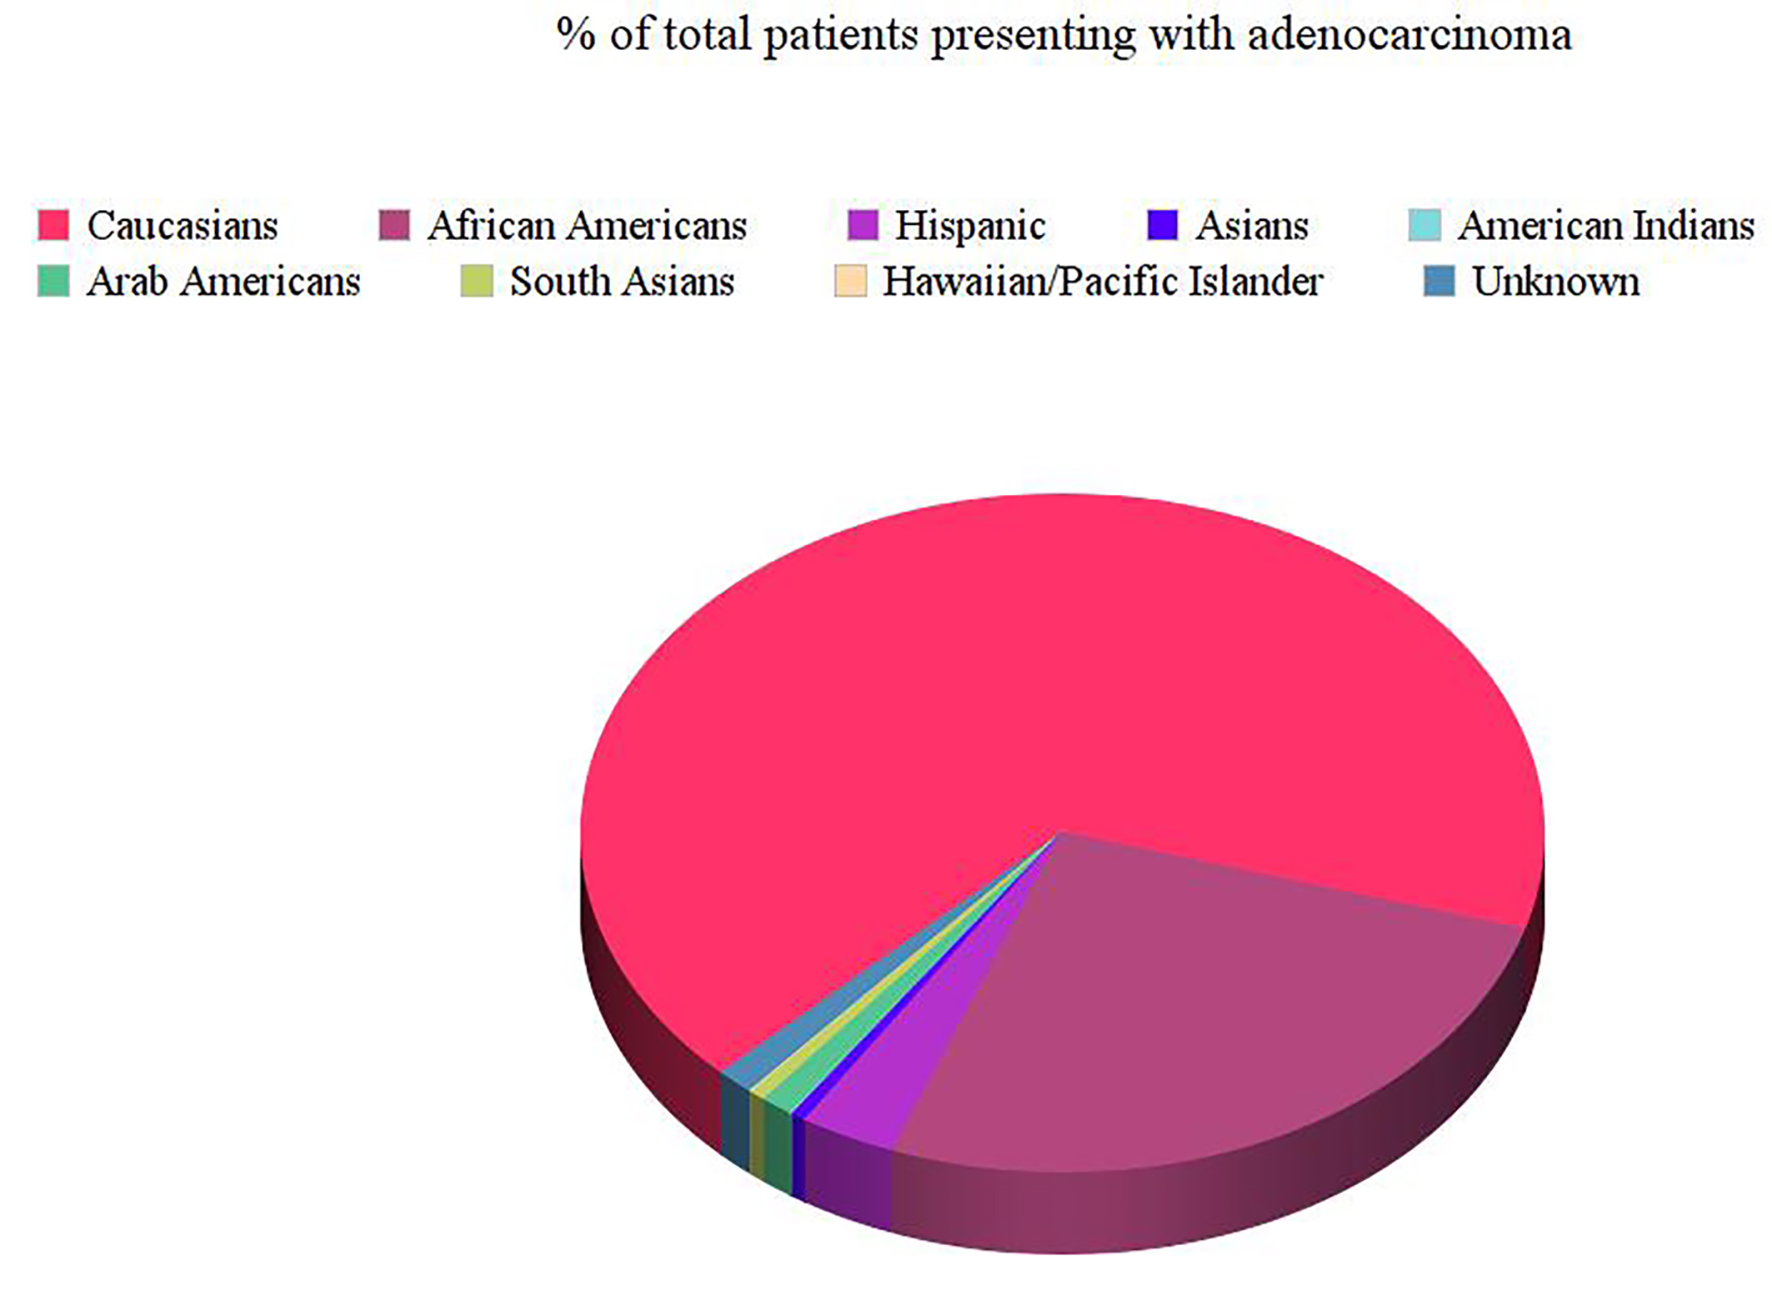
| Race | Number of patients | % of total |
|---|---|---|
| African American | 498 | 27.09 |
| Caucasian | 1206 | 65.61 |
| South Asian | 10 | 0.54 |
| Arabs | 19 | 1.03 |
| Mexican-Americans | 71 | 3.86 |
| Asians | 10 | 0.54 |
| American Indian | 4 | 0.22 |
| Hawaiian/Pacific Islander | 1 | 0.05 |
| Unknown | 19 | 1.03 |
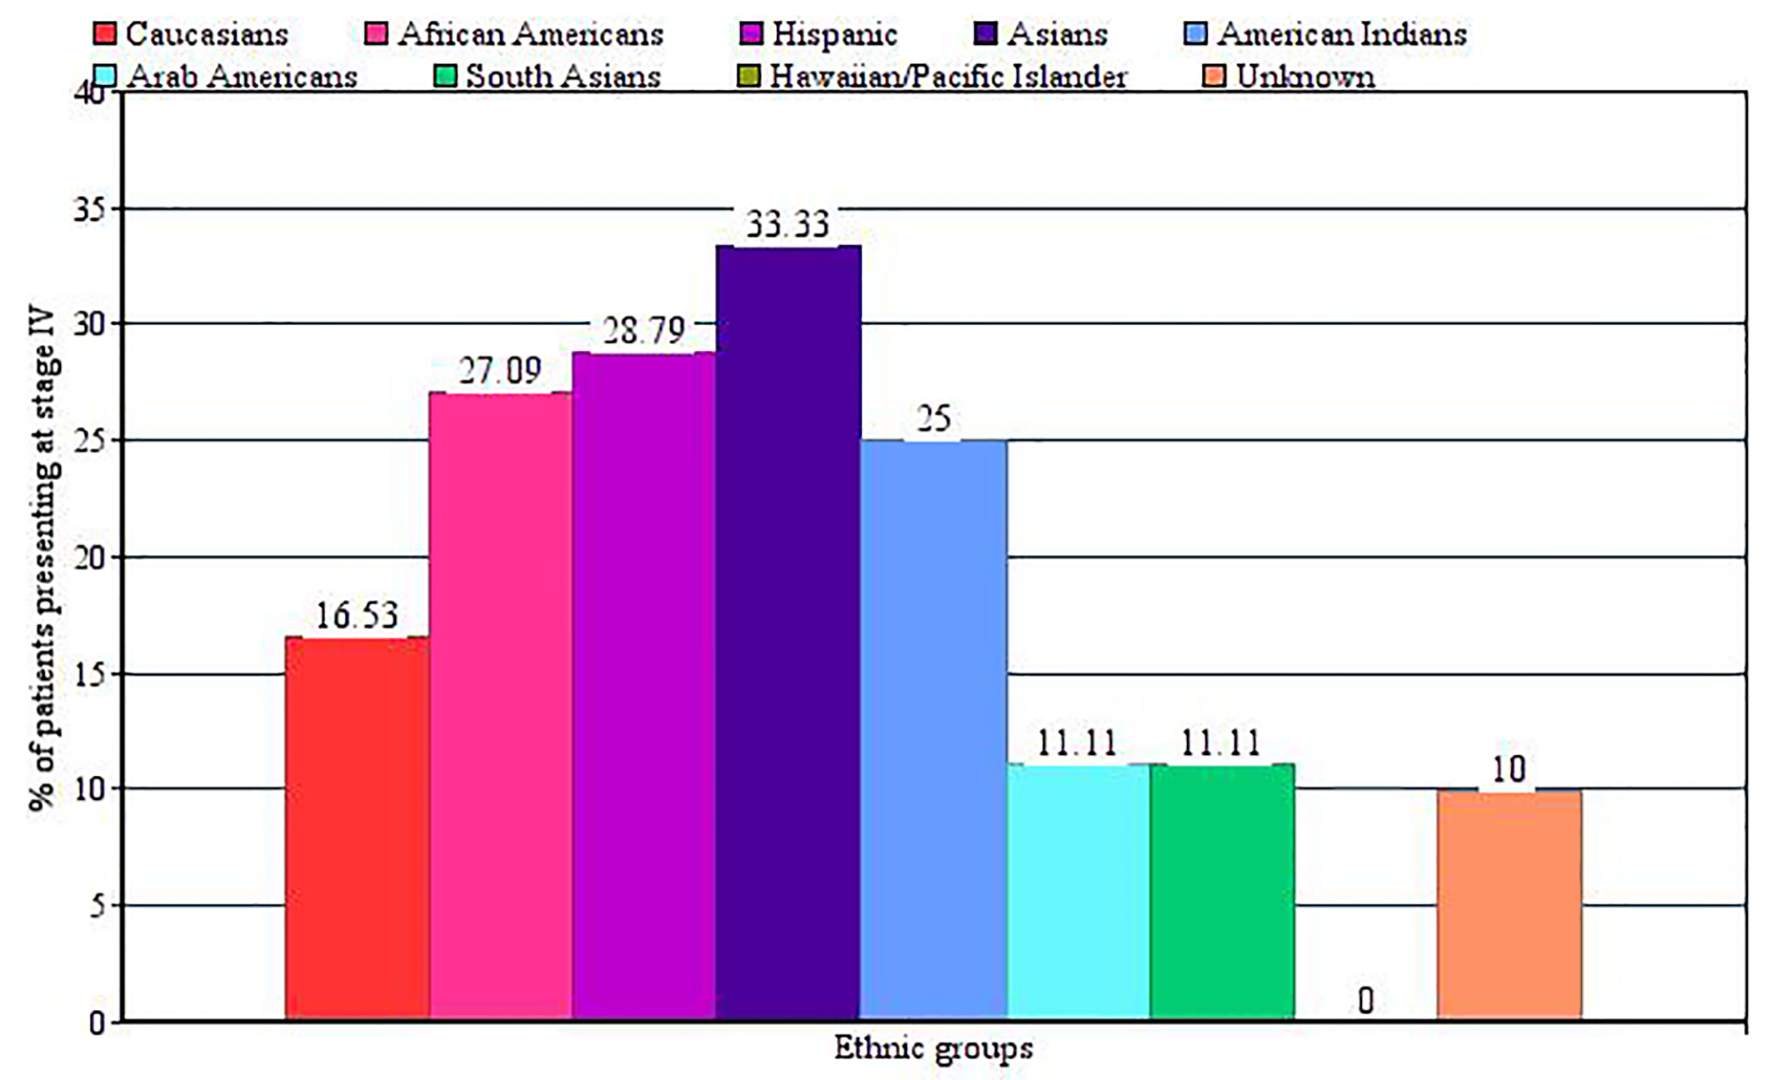
| Race | Stage of CRC (% within racial group) | ||||
|---|---|---|---|---|---|
| 0 | 1 | 2 | 3 | 4 | |
| Caucasian | 12.3% | 22.6% | 23.6% | 24.8% | 16.5 % |
| African American | 13.0% | 19.1% | 20.5% | 20.0% | 27.0% |
| Hispanic | 18.1% | 19.7% | 19.7% | 13.6% | 28.7% |
| South Asian | 11.1% | 11.1% | 33.3% | 33.3% | 11.1% |
| Arabs | 11.1% | 16.6% | 50.0% | 11.1% | 11.1% |
| American Indians | 0.0% | 50.0% | 25.0% | 0.0% | 25.0% |
| Asian | 33.3% | 0.0% | 11.1% | 22.2% | 33.3% |