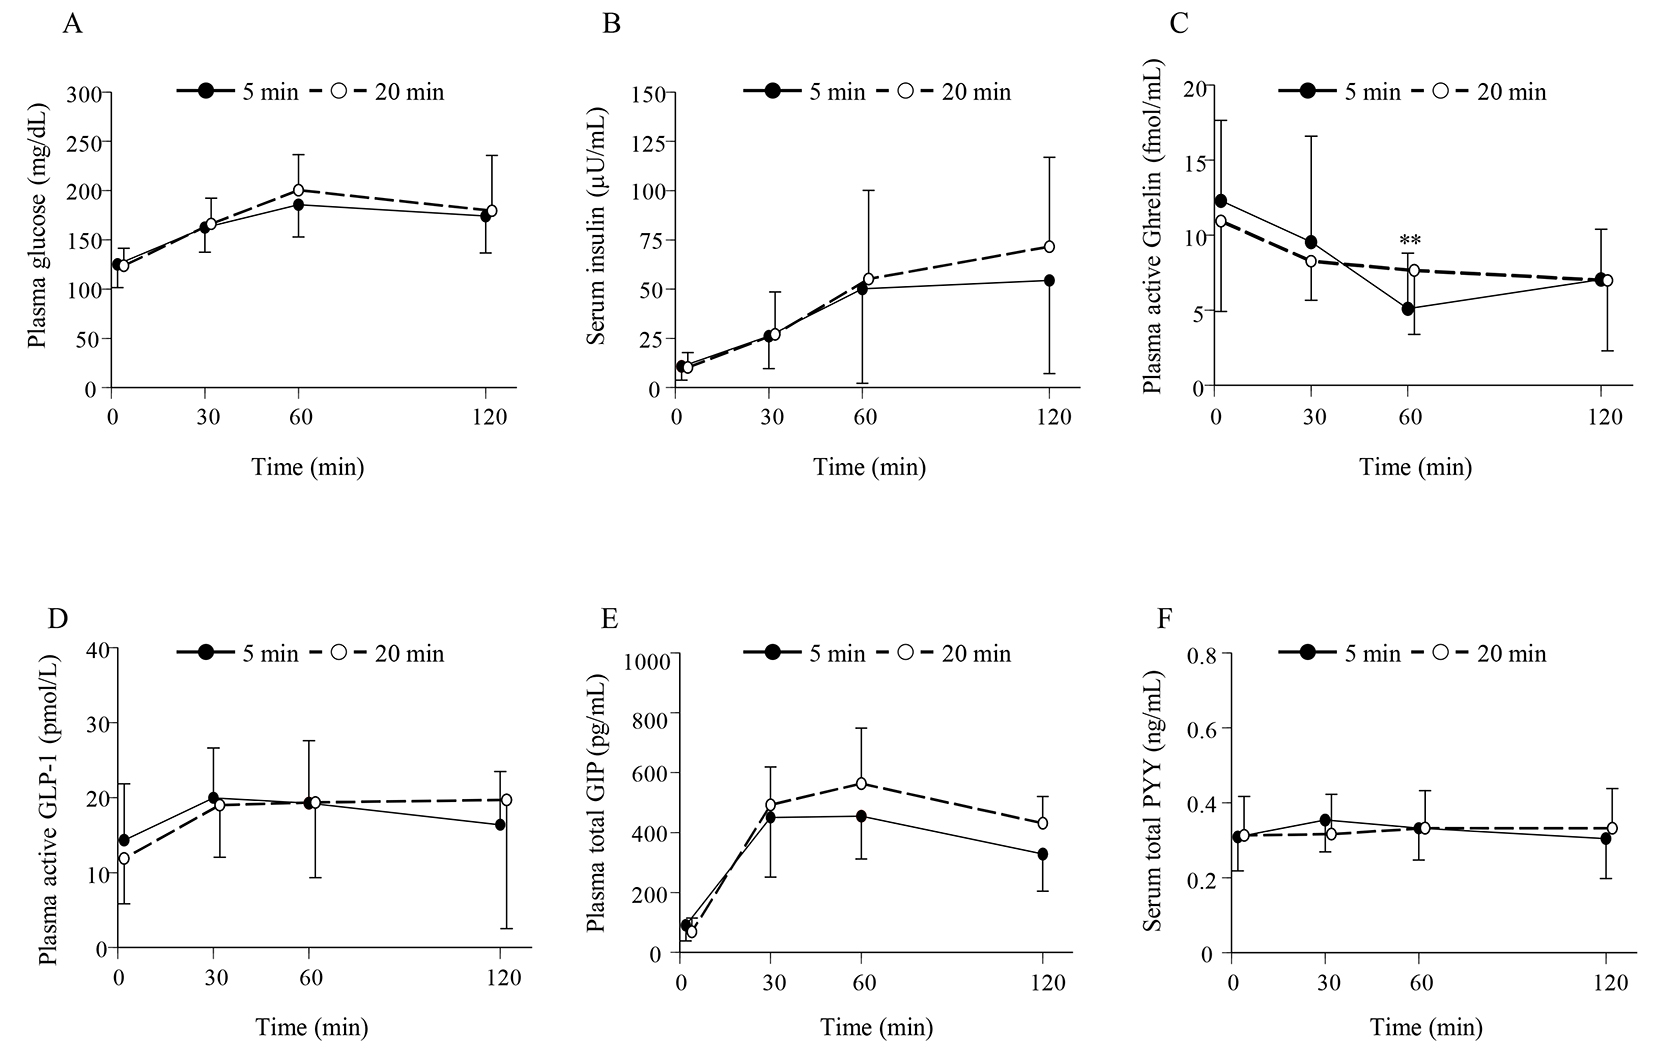
Figure 1. (A) Time profiles for the plasma glucose, (B) serum insulin, (C) plasma active ghrelin, (D) plasma active GLP-1, (E) plasma total GIP, and (F) serum total PYY levels for the 5-min and 20-min groups. Data are expressed as the mean ± SD. **P < 0.01 between two groups.

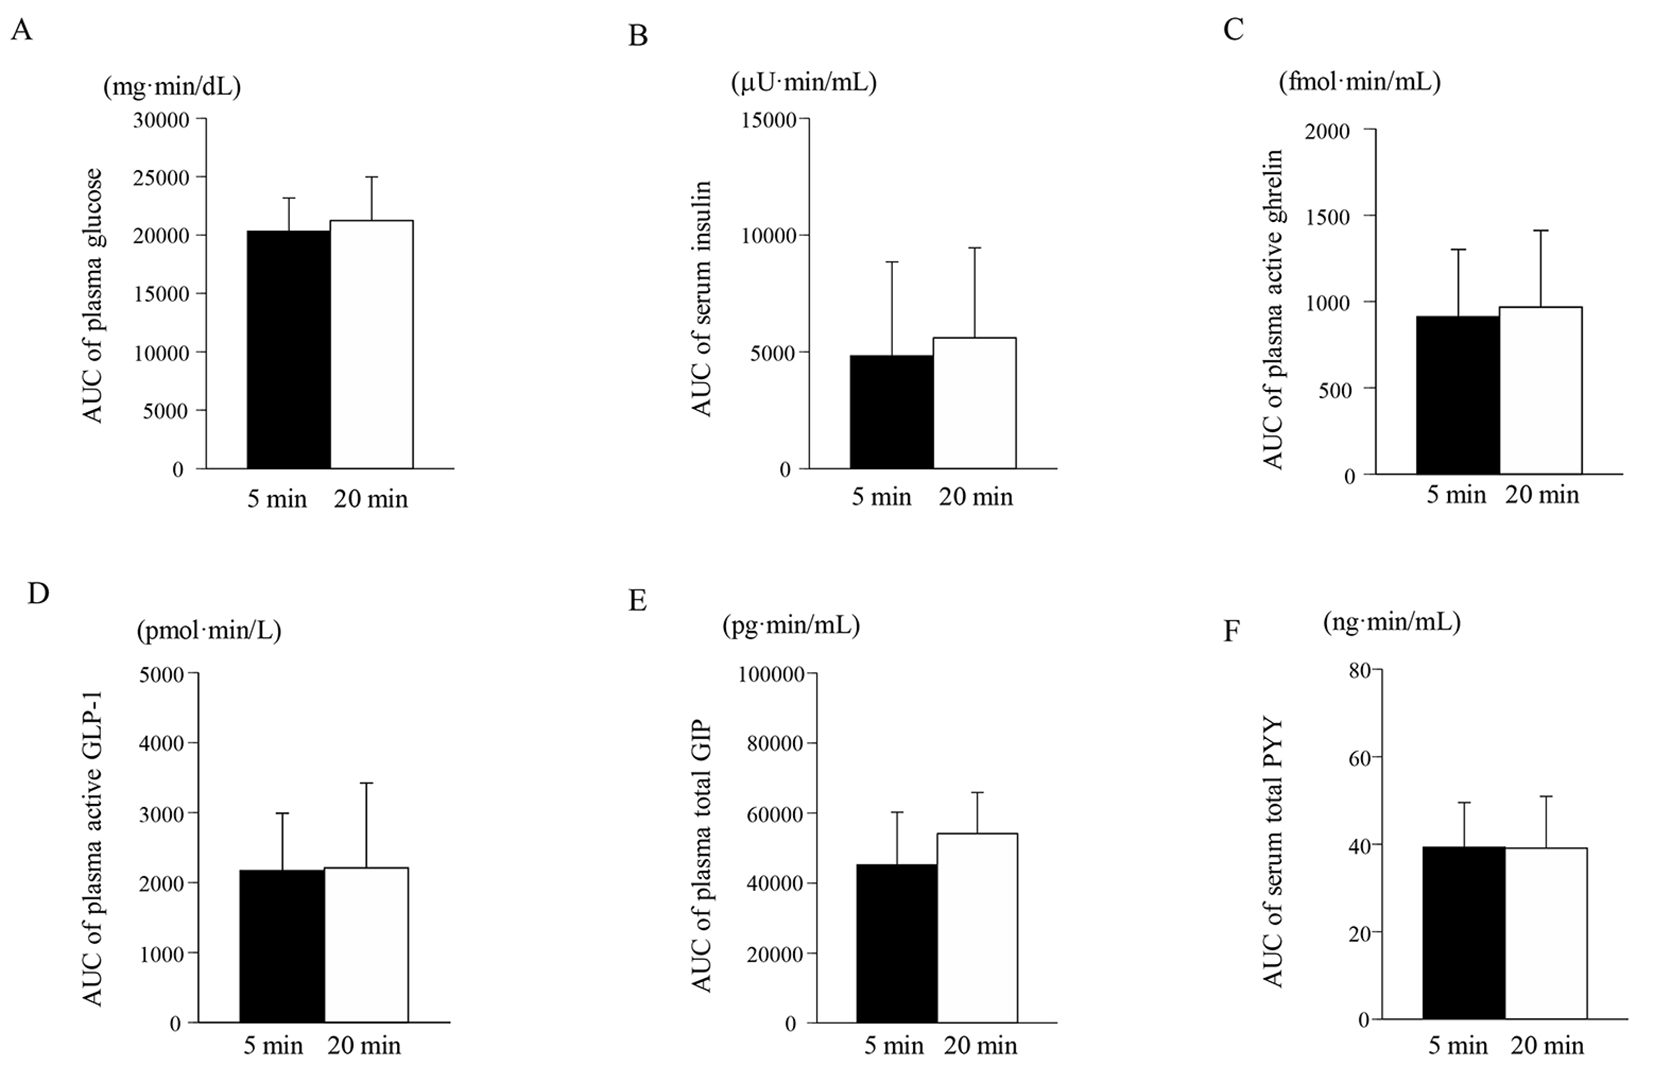
Figure 2. Area under the curve (AUC) for the plasma glucose (A), serum insulin (B), plasma active ghrelin (C), plasma active GLP-1 (D), plasma total GIP (E), and serum total PYY (F) levels from 0 to 120 min for the 5-min and 20-min groups. Data are expressed as the mean ± SD.

