Journal of Clinical Medicine Research, ISSN 1918-3003 print, 1918-3011 online, Open Access
Article copyright, the authors; Journal compilation copyright, J Clin Med Res and Elmer Press Inc
Journal website http://www.jocmr.org

Original Article

Volume 8, Number 9, September 2016, pages 650-655


Ultrasound Elastography Used for Preventive Non-Invasive Screening in Early Detection of Liver Fibrosis

Figures

Figure 1.
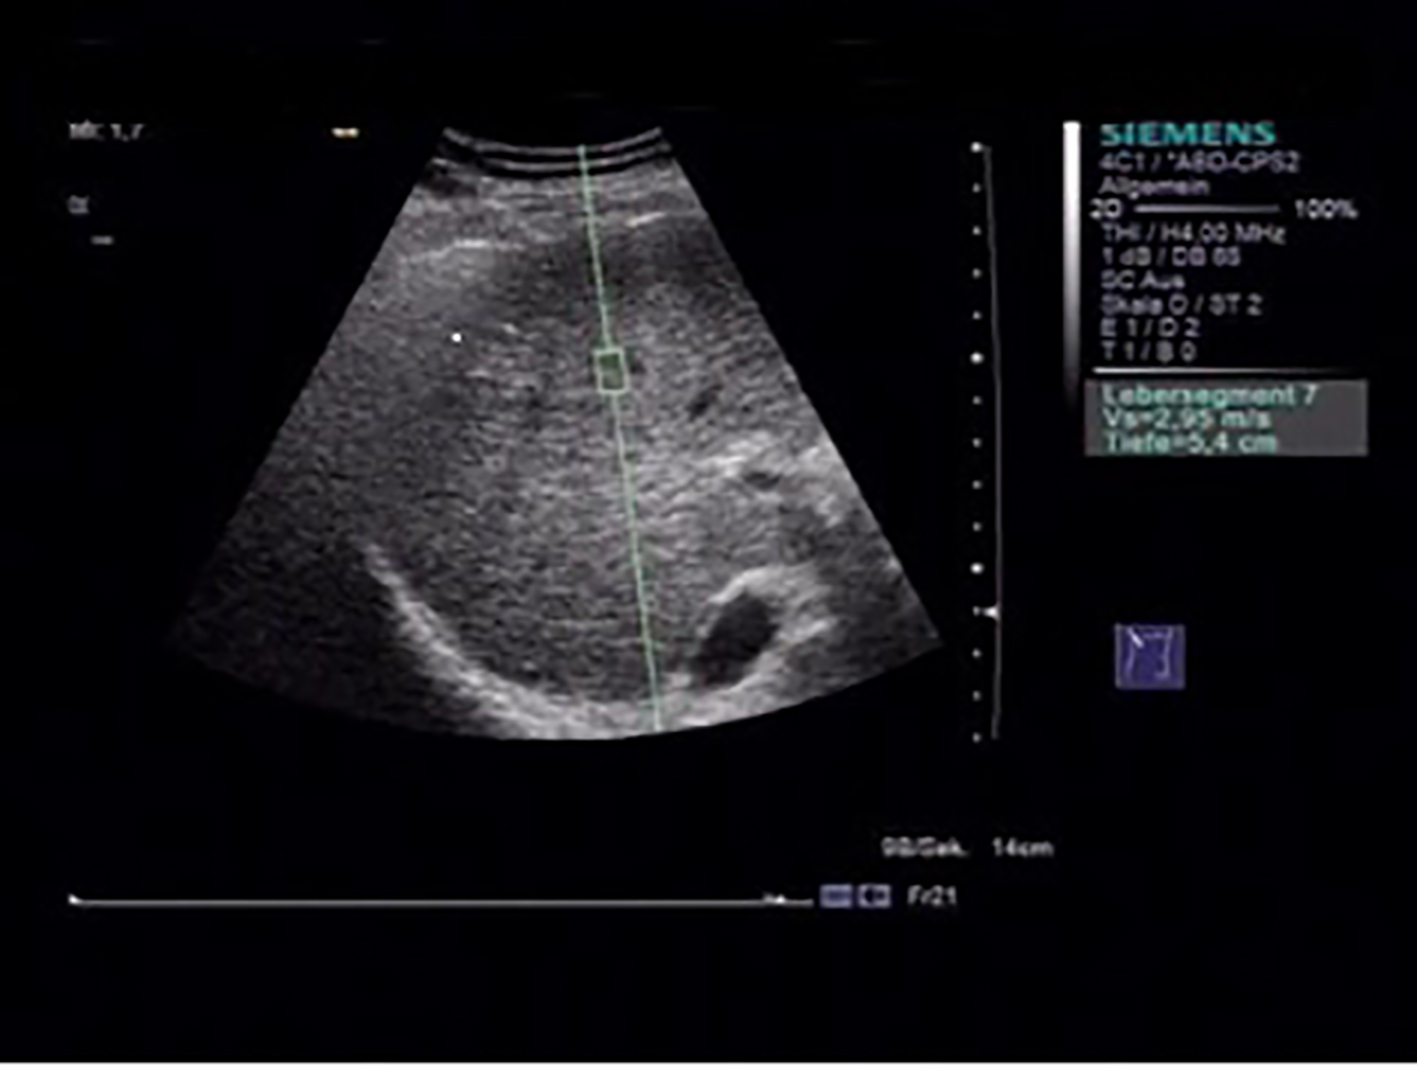
Figure 1. Acoustic radiation force impulse (ARFI) measurement, with the flexible metering box (“measurement box” as size of region of interest (ROI), 10 mm long, 5 mm wide) is possible to localize a region of the liver for elastographic measurement at variable depths.
Figure 2.
Figure 2. Fibrosis stages F1*-F4 in groups 1-6. (*Stage F1 includes although F0).

Tables

Table 1. Results of Native Ultrasound Scan of the Liver
 
Native ultrasound (US) resultsGroup (groups 1-6: N = 382)
Normal native USControls (N = 20); group 1 (N = 131)
Fatty liver grade IGroup 2 (N = 70)
Fatty liver grade IIGroup 3 (N = 34)
Fatty liver grade IIIGroup 4 (N = 45)
Cirrhotic tissueGroup 5 (N = 43)
Inhomogenic tissueGroup 6 (N = 59)


Table 2. Characteristics of Patients Shown as Mean ± Standard Deviation and Patients Distribution in Different Groups Divided by Native Ultrasound Scan and Patients Separated in Two Groups (Cirrhosis (F4) Versus Non-Cirrhosis (F0-3))
 
CharacteristicsTotal (without controls)Groups 1-4Group 5 (cirrhosis)Group 6 (inhomogenic tissue)ControlsGroups 1-6 (cirrhosis)Groups 1-6 (non-cirrhosis)P-value
P-values were obtained by the unpaired t-test.
Total38228043592064318
gender (male/female)198/184143/14726/1734/254265335/28163/155
Age (years)56 ± 2664 ± 2862 ± 1359 ± 1552 ± 1466 ± 1653 ± 23n.s.
BMI (kg/m2)26 ± 629 ± 326 ± 425 ± 525 ± 326 ± 427 ± 3n.s.
ALT (< 35 U/L)80 ± 4595 ± 3358 ± 4776 ± 5445 ± 2287 ± 4753 ± 33n.s.
Thrombocytes (170 - 440 × 103/µL)232 ± 113245 ± 120163 ± 114280 ± 82240 ± 112163 ± 114280 ± 82< 0.001
F0-1206 (19.90%)199 ± 3 (70-79%)0 (0%)5 (9%)20 (100%)206 (19.90%)
F278 (22.41%)48 ± 16 (11-23%)1 (3%)22 (38%)78 (22.41%)
F334 (8.90%)12 ± 7 (2-7%)9 (22%)11 (19%)34 (8.90%)
F464 (16.75%)11 ± 10 (1-8%)33 (75%)20 (34%)64 (16.75%)


Table 3. Distribution of Patients With Elevated SWV (F2-4): Main Causes
 
Group 1 (N = 33)Group 2 (N = 22)Group 3 (N = 9)Group 4 (N = 13)Group 5 (N = 43)Group 6 (N = 53)
ASH08251018
Hepatitis B/C301233
Heart failure731135
NASH09431615
AIH/PBC/PSC300043
Unknown2021279