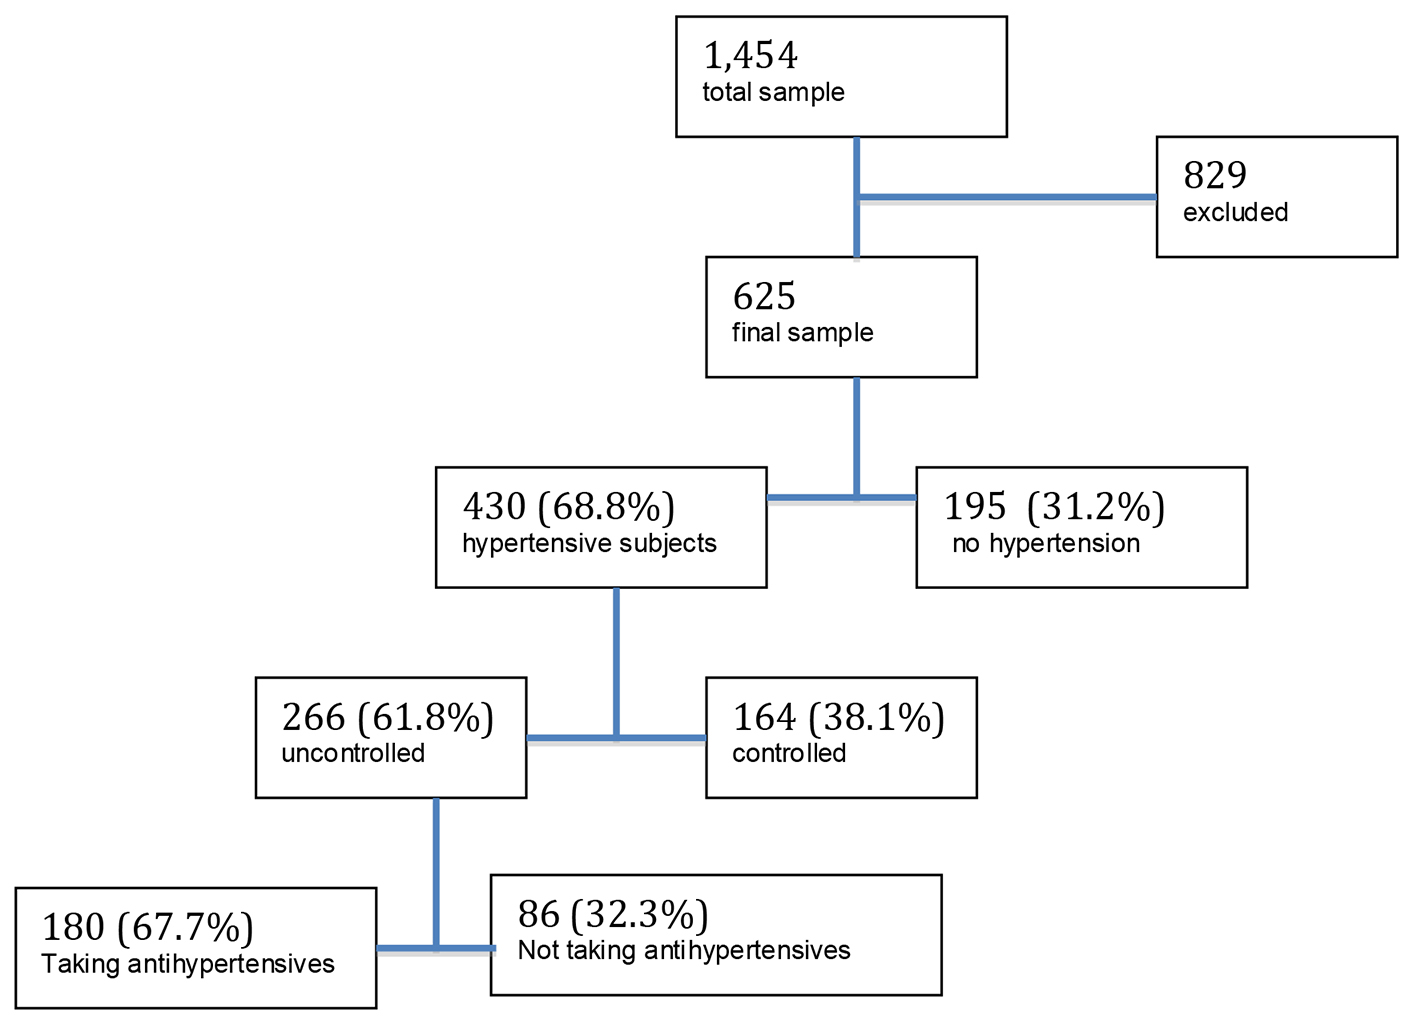
Figure 1. Sample selection.
| Journal of Clinical Medicine Research, ISSN 1918-3003 print, 1918-3011 online, Open Access |
| Article copyright, the authors; Journal compilation copyright, J Clin Med Res and Elmer Press Inc |
| Journal website http://www.jocmr.org |
Original Article
Volume 8, Number 7, July 2016, pages 524-530
Hypertension Prevalence, Awareness and Blood Pressure Control in Matao, Brazil: A Pilot Study in Partnership With the Brazilian Family Health Strategy Program
Figures
Tables
| Variables | Total | Hypertension | No hypertension | P | |||
|---|---|---|---|---|---|---|---|
| n | % | n | % | n | % | ||
| Gender | < 0.001 | ||||||
| Men | 220 | 35.2 | 63.2 | 139 | 81 | 36.8 | |
| Women | 405 | 64.8 | 71.9 | 291 | 114 | 28.1 | |
| Age groups (years) | < 0.001 | ||||||
| 40 - 49 | 108 | 17.3 | 46.3 | 50 | 58 | 53.7 | |
| 50 - 59 | 145 | 23.3 | 65.5 | 95 | 50 | 34.5 | |
| 60 - 69 | 186 | 29.8 | 72.6 | 135 | 51 | 24.4 | |
| 70 - 79 | 126 | 20.2 | 82.5 | 104 | 22 | 17.5 | |
| ≥ 80 | 58 | 9.3 | 77.6 | 45 | 13 | 22.4 | |
| Variables | Hypertension awareness | Use of antihypertensives | ||||
|---|---|---|---|---|---|---|
| n | % | P | n | % | P | |
| *There was a significant difference between men and women and also between normal and pre-hypertension versus stage 1 and 2. | ||||||
| Gender | < 0.001 | < 0.001 | ||||
| Men | 94 | 67.6 | 89 | 64.0 | ||
| Women | 258 | 88.7 | 254 | 87.3 | ||
| Age groups (years) | 0.10 | 0.06 | ||||
| 40 - 49 | 36 | 72.0 | 33 | 66.0 | ||
| 50 - 59 | 80 | 84.2 | 79 | 83.2 | ||
| 60 - 69 | 109 | 80.7 | 107 | 79.3 | ||
| 70 - 79 | 84 | 80.8 | 83 | 79.8 | ||
| ≥ 80 | 42 | 93.3 | 40 | 78.9 | ||
| Hypertension stages | < 0.001* | < 0.001* | ||||
| Normal | 48 | 100 | 47 | 97.9 | ||
| Pre-hypertension | 114 | 98.3 | 114 | 98.3 | ||
| Stage 1 | 113 | 70.2 | 111 | 68.9 | ||
| Stage 2 | 77 | 73.3 | 71 | 67.6 | ||