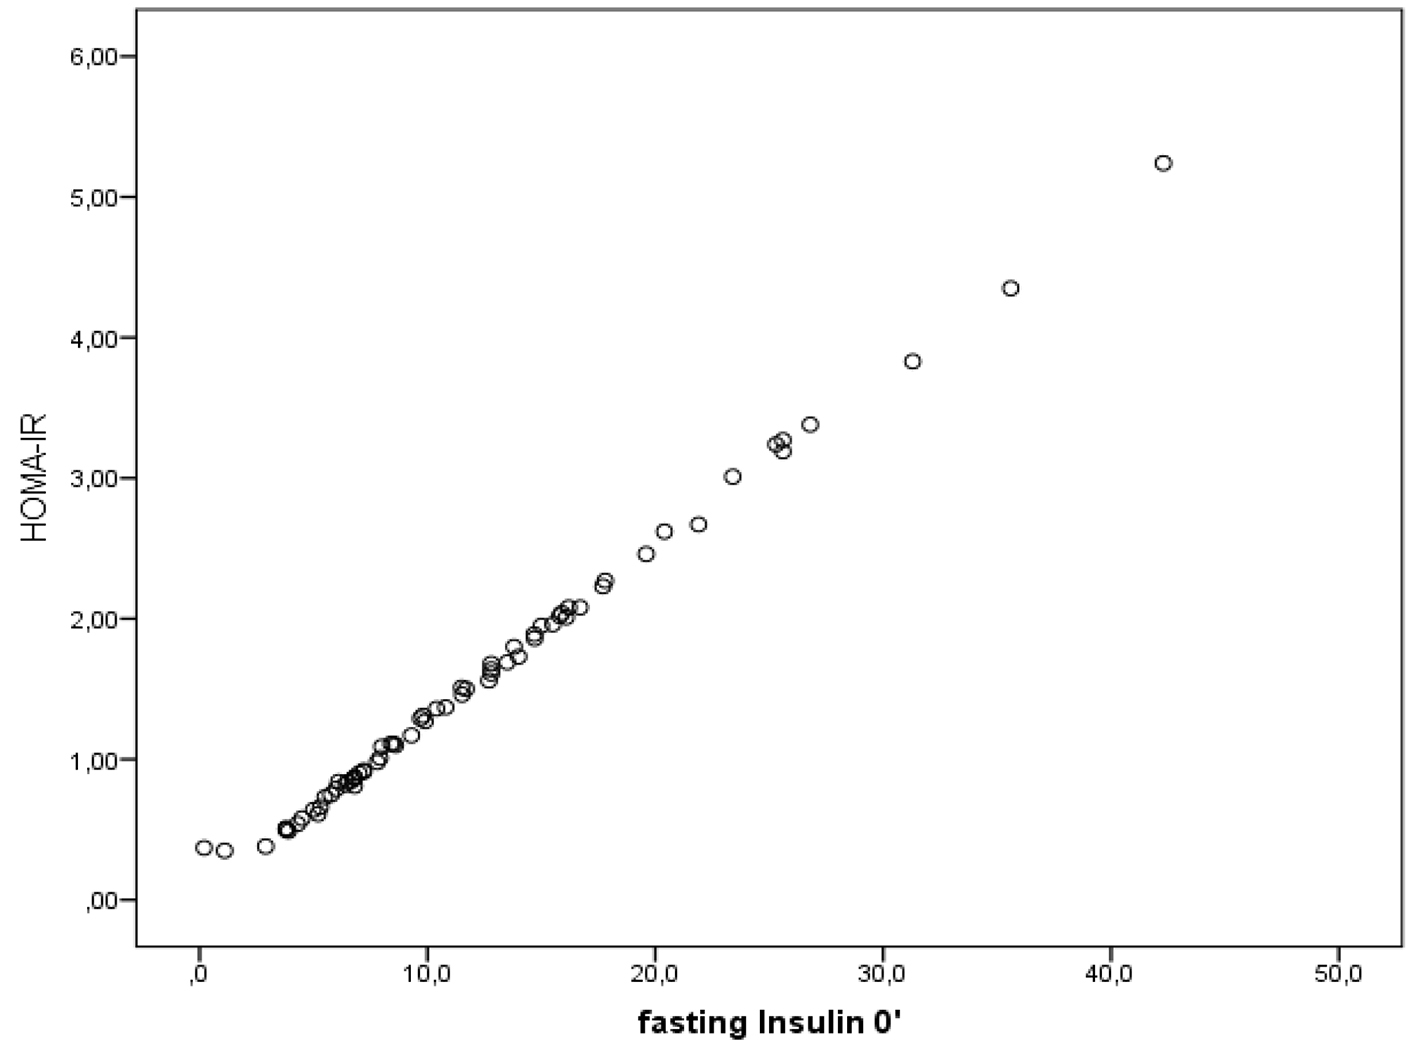
Figure 1. Relation of HOMA with IR (r = 0.998, P < 0.001).
| Journal of Clinical Medicine Research, ISSN 1918-3003 print, 1918-3011 online, Open Access |
| Article copyright, the authors; Journal compilation copyright, J Clin Med Res and Elmer Press Inc |
| Journal website http://www.jocmr.org |
Original Article
Volume 8, Number 6, June 2016, pages 431-436
Associations of Apolipoprotein A, High-Sensitivity C-Reactive Protein and Fasting Plasma Insulin in Obese Children With and Without Family History of Cardiovascular Disease
Figure
Tables
| Boys (N = 28), mean ± SD | Girls (N = 40), mean ± SD | P-value | |
|---|---|---|---|
| P < 0.05. aMann-Whitney test, all other t-test. | |||
| Age (years) | 9.78 ± 3.48 | 9.48 ± 2.71 | 0.684 |
| Height (cm) | 1.41 ± 0.19 | 1.39 ± 0.15 | 0.479 |
| Weight (kg)a | 50.2 ± 26.4 | 43 ± 21.9 | 0.223 |
| BMI (kg/m2)a | 23.67 ± 7.4 | 21.2 ± 6.6 | 0.182 |
| SBP (mm Hg) | 59.72 ± 7.8 | 50.3 ± 29.2 | 0.185 |
| DBP (mm Hg) | 57.32 ± 8.8 | 49.2 ± 25.4 | 0.224 |
| TC (mg/dL)a | 162.4 ± 45.5 | 162.8 ± 29.7 | 0.974 |
| TG (mg/dL)a | 78.5 ± 39.5 | 83.9 ± 45 | 0.605 |
| HDL (mg/dL)a | 48.3 ± 14.7 | 52.3 ± 16.8 | 0.307 |
| LDL (mg/dL) | 92 ± 24.1 | 95 ± 22.8 | 0.543 |
| ApoA (mg/dL) | 133.53 ± 0 | 140.3 ± 27.1 | 0.330 |
| ApoB (mg/dL)a | 69.9 ± 22.2 | 63.6 ± 15.1 | 0.165 |
| Variables | Normal | Obese | ||||
|---|---|---|---|---|---|---|
| PFH (n = 8) | NFH (n = 25) | Total (n = 33) | PFH (n = 15) | NFH (n = 20) | Total (n = 35) | |
| P < 0.05. aDistribution not normal (median, min. - max.). bData presented as log (geometric mean × geometric SD). *Statistically significant difference between obese and normal group. **Statistically significant difference between obese and normal group with PFH. | ||||||
| SBP | 54 ± 23.9 | 38.9 ± 26.6 | 42.5 ± 26.4 | 68.5 ± 24.9 | 63.2 ± 28.2 | 65.5 ± 26.6* |
| DBP | 47.5 ± 30.1 | 51.2 ± 30.4 | 50.3 ± 29.9 | 53.3 ± 29.9 | 56 ± 19.9 | 54.9 ± 24.3 |
| TC | 167 ± 33 | 166 ± 30 | 167 ± 31 | 191 ± 18 | 178 ± 24 | 181 ± 24.5* |
| TG | 59.5 ± 22.5 | 73.8 ± 42.2 | 70.4 ± 38.7 | 88 ± 44.5 | 95.9 ± 44.2 | 92.5 ± 43.8* |
| HDL | 64.9 ± 19.3 | 54.4 ± 17.5 | 56.9 ± 18.2 | 41.9 ± 10 | 46.5 ± 10.6 | 44.5 ± 10.5* |
| LDL | 88.8 ± 29.5 | 92 ± 43.4 | 90.4 ± 40.6 | 104.4 ± 21 | 99.5 ± 23 | 101 ± 22.9 |
| ApoA | 159.9 ± 25 | 141 ± 31.6 | 145.6 ± 31 | 135.4 ± 21.8** | 121 ± 23.6 | 129 ± 23.3* |
| ApoB | 61 ± 15.6 | 67.3 ± 19.3 | 65.9 ± 18.5 | 66.6 ± 22.8 | 66.7 ± 15.9 | 66.7 ± 18.9 |
| Lp(a)a | 20 (3.4 - 113.9) | 21.2 (2 - 200) | 21.2 (2 - 200) | 16.5 (4.1 - 106) | 16.5 (4.4 - 87) | 16.5 (4.1 - 106) |
| hsCRPa | 0.11 (0.01 - 2.54) | 0.08 (0.01 - 2.6) | 0.08 (0.01 - 2.6) | 0.78 (0.03 - 2.8) | 0.73 (0.02 - 2.7) | 0.75 (0.02 - 2.8)* |
| FBG | 84.4 ± 12 | 88 ± 7.7 | 87 ± 8.9 | 87 ± 8.7 | 89.5 ± 8 | 88.4 ± 8.4 |
| FPIa | 6.6 (1.1 - 35.6) | 8.6 (2.9 - 159) | 8.2 (1.1 - 159) | 16 (4.5 - 42)** | 11.8 (0.2 - 31) | 12.8 (0.2 - 42)* |
| HOMA-IRb | 0.95 × 2.28 (0.35 - 4.35) | 1.06 × 1.68 (0.38 - 3.24) | 1.03 × 1.81 (0.35 - 4.35) | 1.8 × 1.9 (0.58 - 5.24) | 1.43 × 1.77 (0.37 - 3.83) | 1.58 × 1.83* (0.37 - 5.24) |
| Univariate logistic regression results* | ||||
|---|---|---|---|---|
| OR | 95% CI | P-value | Sensitivity/specificity | |
| *P < 0.05. | ||||
| SBP (mm Hg) | 1.018 | 0.999 - 1.037 | 0.064 | 0.13/0.93 |
| TC (mg/dL) | 1.983 | 1.965 - 2.001 | 0.070 | 0.13/0.96 |
| TG (mg/dL) | 0.997 | 0.985 - 1.009 | 0.624 | 0.00/1.00 |
| HDL (mg/dL) | 0.996 | 0.965 - 1.028 | 0.801 | 0.00/1.00 |
| ApoA (mg/dL) | 0.995 | 0.978 - 1.013 | 0.603 | 0.00/1.00 |
| hsCRP | 1.367 | 0.689 - 2.715 | 0.371 | 0.00/1.00 |
| FPI (mIU/mL) | 1.058 | 0.993 - 1.127 | 0.080 | 0.17/0.94 |
| HOMA-IR | 1.570 | 0.941 - 2.619 | 0.084 | 0.17/0.94 |
| Multivariate logistic regression analysis | ||||
|---|---|---|---|---|
| OR | 95% CI | P-value | Sensitivity/specificity | |
| *P < 0.05. | ||||
| SBP (mm Hg) | 1.045 | 1.016 - 1.074 | 0.002* | 0.13/0.93 |
| TC (mg/dL) | 1.965 | 1.935 - 2.970 | 0.031* | 0.13/0.96 |
| TG (mg/dL) | 0.997 | 0.985 - 1.009 | 0.624 | 0.00/1.00 |
| HDL (mg/dL) | 0.996 | 0.965 - 1.028 | 0.801 | 0.00/1.00 |
| ApoA (mg/dL) | 0.995 | 0.978 - 1.013 | 0.603 | 0.00/1.00 |
| hsCRP | 2.92 | 0.966 - 8.828 | 0.058 | 0.00/1.00 |
| FPI (mIU/mL) | 1.058 | 0.993 - 1.127 | 0.080 | 0.17/0.94 |
| HOMA-IR | 1.570 | 0.941 - 2.619 | 0.084 | 0.17/0.94 |