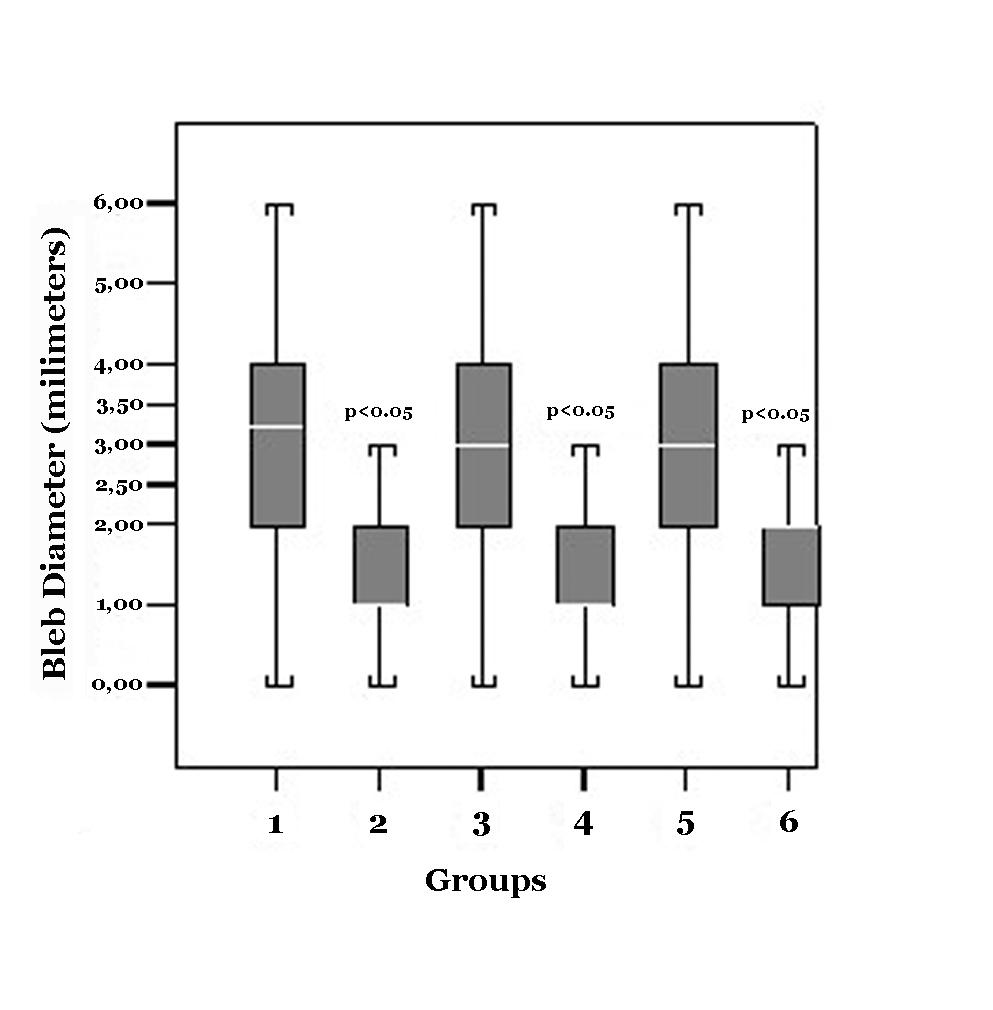
Figure 1. Box plot Graphics demonstrates the amount of reflux after the injection
| Journal of Clinical Medicine Research, ISSN 1918-3003 print, 1918-3011 online, Open Access |
| Article copyright, the authors; Journal compilation copyright, J Clin Med Res and Elmer Press Inc |
| Journal website http://www.jocmr.org |
Original Article
Volume 1, Number 5, December 2009, pages 280-284
The Effects of Injection Site on the Reflux Following Intravitreal Injections
Figure
Table
| Groups | Subconjunctival Bleb Diameters(Mean ± SD) | IOP Measurements |
|---|---|---|
| (Mean ± SD) | ||
| IVTA: Intravitreal Triamcinolone; IVB: Intravitreal bevacizumab; IVP: Intravitreal pegaptanib. | ||
| Group 1 (IVTA-Superotemporal Injection) | 3.20 ± 1.63 mm | 17.6 ± 4.1 mm Hg |
| Group 2 (IVTA-Inferotemporal Injection) | 1.50 ± 0.94 mm | 19.0 ± 4.7 mm Hg |
| Group 3 (IVB-Superotemporal Injection) | 3.07 ± 1.53 mm | 15.3 ± 3.1 mm Hg |
| Group 4 (IVB-Inferotemporal Injection) | 1.60 ± 1.07 mm | 16.8 ± 3.5 mm Hg |
| Group 5 (IVP-Superotemporal Injection) | 2.80 ± 1.32 mm | 18.4 ± 4.4 mm Hg |
| Group 6 (IVP-Inferotemporal Injection) | 1.77 ± 0.94 mm | 20.1 ± 5.2 mm Hg |
| P value | P < 0.05 Group 1 vs. Group 2 | P > 0.05 for all the groups |
| P < 0.05 Group 3 vs. Group 4 | ||
| P < 0.05 Group 5 vs. Group 6 | ||