Figure 1. Concentrations of PCT.
| Journal of Clinical Medicine Research, ISSN 1918-3003 print, 1918-3011 online, Open Access |
| Article copyright, the authors; Journal compilation copyright, J Clin Med Res and Elmer Press Inc |
| Journal website http://www.jocmr.org |
Original Article
Volume 1, Number 2, June 2009, pages 90-94
The Pattern of Procalcitonin in Primary Total Hip and Knee Arthroplasty and its Implication in Periprosthetic Infection
Figure
Tables
| Variable | Mean | St Dev | Minimum | Q1 | Median | Q3 | Maximum |
|---|---|---|---|---|---|---|---|
| AVE PCT | 0.5096 | 1.117 | 0.3 | 0.3 | 0.3 | 0.3 | 10 |
| AVE CRP | 87.28 | 61.02 | 10 | 39 | 83 | 121 | 292 |
| AVE ESR | 51.36 | 31.37 | 4 | 25.5 | 48 | 77 | 125 |
| AVE WCC | 9.672 | 2.579 | 4.6 | 7.75 | 9.5 | 11.1 | 18.3 |
| Variable | Mean | St Dev | Minimum | Q1 | Median | Q3 | Maximum |
|---|---|---|---|---|---|---|---|
| Day 0 PCT | 0.3797 | 0.6119 | 0.3 | 0.3 | 0.3 | 0.3 | 5 |
| Day 1 PCT | 0.4051 | 0.3496 | 0.3 | 0.3 | 0.3 | 0.3 | 2 |
| Day 3 PCT | 0.798 | 1.877 | 0.3 | 0.3 | 0.3 | 0.3 | 10 |
| Day 5 PCT | 0.3254 | 0.1027 | 0.3 | 0.3 | 0.3 | 0.3 | 1 |
| Day 0 CRP | 11.78 | 9.64 | 2 | 10 | 10 | 10 | 62 |
| Day 1 CRP | 75.32 | 47.22 | 12 | 38 | 66 | 98 | 189 |
| Day 3 CRP | 129.02 | 62.44 | 10 | 91 | 120 | 162 | 292 |
| Day 5 CRP | 57.49 | 48.47 | 10 | 20 | 46 | 91 | 280 |
| Day 0 ESR | 20.76 | 17.33 | 4 | 7 | 14 | 26 | 77 |
| Day 1 ESR | 31.42 | 25.59 | 4 | 13 | 25 | 42 | 121 |
| Day 3 ESR | 62.56 | 30.48 | 4 | 41 | 59 | 88 | 125 |
| Day 5 ESR | 60.1 | 28.16 | 4 | 42 | 52 | 82 | 122 |
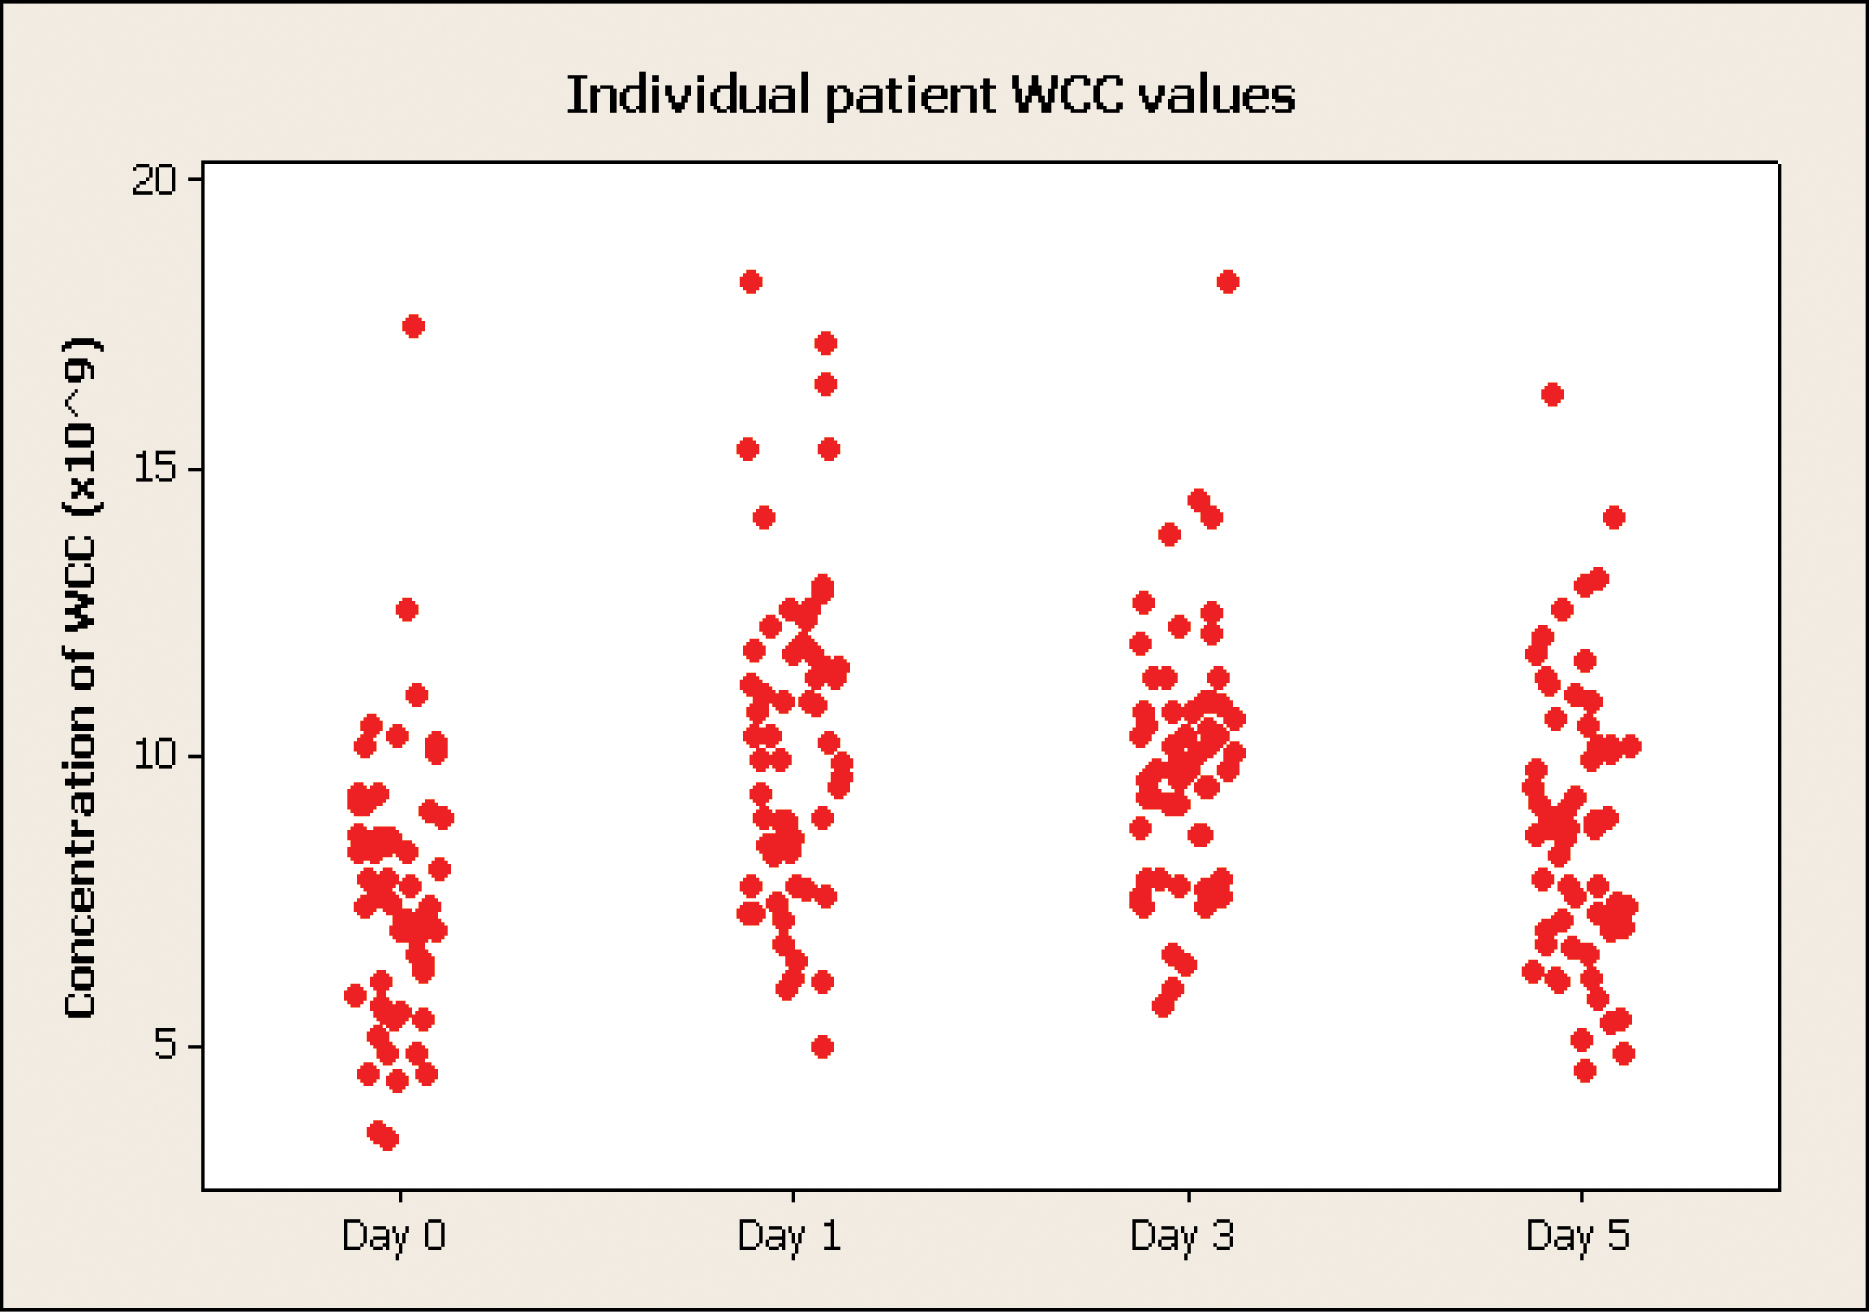
| Day 0 WCC | 7.731 | 2.329 | 3.4 | 6.1 | 7.8 | 9 | 17.5 |
| Day 1 WCC | 10.261 | 2.842 | 5 | 8.3 | 10 | 11.8 | 18.3 |
| Day 3 WCC | 9.922 | 2.229 | 5.7 | 7.9 | 9.8 | 10.9 | 18.3 |
| Day 5 WCC | 8.834 | 2.451 | 4.6 | 7 | 8.8 | 10.2 | 16.3 |