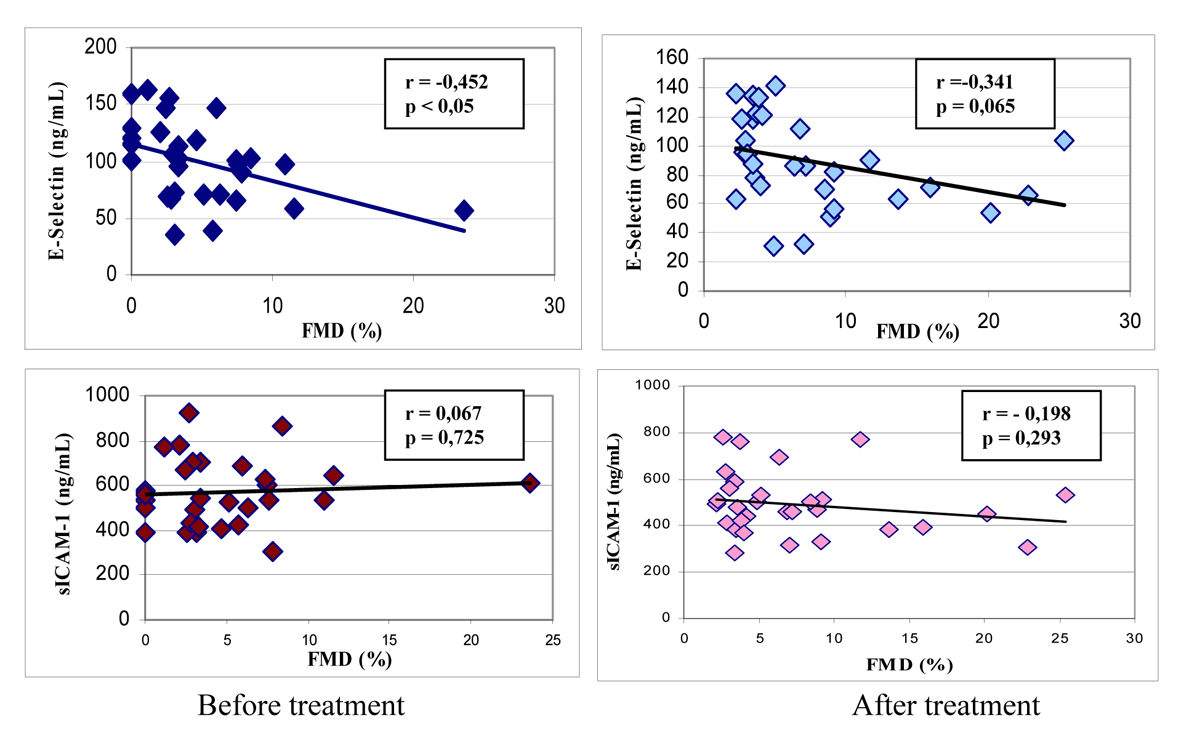
Figure 1. Correlations between %FMD and E-selectin and sICAM-1 levels in patients before and after treatment (mean ± SD).
| Journal of Clinical Medicine Research, ISSN 1918-3003 print, 1918-3011 online, Open Access |
| Article copyright, the authors; Journal compilation copyright, J Clin Med Res and Elmer Press Inc |
| Journal website http://www.jocmr.org |
Original Article
Volume 6, Number 5, October 2014, pages 354-361
Effect of Statins on Endothelial Function in Patients With Acute Coronary Syndrome: A Prospective Study Using Adhesion Molecules and Flow-Mediated Dilatation
Figure
Tables
| Control (n = 26) | Patient (n = 30) | |
|---|---|---|
| *P < 0.001, patient vs. control group. BMI: body mass index; BP: blood pressure; DM: diabetes mellitus; HT: hypertension; HL: hyperlipidemia; BUN: blood urea nitrogen; ALT: alanine aminotransferase; GGT: gamma glutamyl transpeptidase; CK-MB: creatine kinase-MB isoenzyme; cTnI: cardiac troponin I. | ||
| Age (years) | 49.69 ± 6.23 | 52.5 ± 9.16 |
| Weight (kg) | 74.69 ± 6.10 | 78.47 ± 10.92 |
| Height (cm) | 170.4 ± 4.89 | 171.7 ± 5.3 |
| BMI (kg/m2) | 25.6 ± 1.47 | 26.57 ± 3.13 |
| Systolic BP (mm Hg) | 118.3 ± 13.8* | 132.3 ± 21.2 |
| Diastolic BP (mm Hg) | 81.2 ± 4.1 | 88.3 ± 13.1 |
| Smoking (%) | 86 | 77 |
| DM (%) | 0* | 36 |
| HT (%) | 0* | 42 |
| HL (%) | 0* | 28 |
| Glucose (mg/dL) | 88.19 ± 9.45 | 93.07 ± 7.78 |
| BUN (mg/dL) | 13.9 ± 2.80 | 15.83 ± 3.46 |
| Creatinine (mg/dL) | 0.77 ± 0.12 | 0.98 ± 0.14 |
| ALT (U/L) | 20.77 ± 5.64 | 31.07 ± 8.56 |
| GGT (U/L) | 22.39 ± 11.92 | 28.50 ± 6.96 |
| Total protein (mg/dL) | 7.46 ± 0.45 | 7.45 ± 0.54 |
| Albumin (mg/dL) | 4.58 ± 0.23 | 3.95 ± 0.51 |
| CK-MB (U/L) | 0 - 25* | 57.77 ± 18.62 |
| cTnI (ng/mL, baseline) | 0 - 0.4* | 6.44 ± 2.24 |
| cTnI (ng/mL, highest value) | N/A | 33.92 ± 13.98 |
| Control (n = 26) | Patient before treatment (n = 30) | Patient 3 months after treatment (n = 30) | Control 3 months after follow-up (n = 26) | |
|---|---|---|---|---|
| *P < 0.001, **P < 0.05 pre- vs. post-treatment. LDL: low-density lipoprotein; HDL: high-density lipoprotein; VLDL: very-low-density lipoprotein; T: total. | ||||
| T-cholesterol (mg/dL) | 188.0 ± 29.23 | 194.3 ± 42.48 | 168.3 ± 25.26* | 182 ± 31.3 |
| LDL-cholesterol (mg/dL) | 119.1 ± 23.31 | 123.1 ± 28.94 | 98.70 ± 16.14* | 122 ± 29.2 |
| VLDL-cholesterol (mg/dL) | 28.15 ± 13.41 | 35.67 ± 21.62 | 31.87 ± 10.56 | 27.1 ± 16.4 |
| HDL-cholesterol (mg/dL) | 40.69 ± 9.25 | 36.33 ± 8.30 | 37.70 ± 7.40 | 41.2 ± 8.5 |
| Triglyceride (mg/dL) | 140.8 ± 66.98 | 173.4 ± 94.27 | 147.4 ± 59.00** | 145 ± 56.8 |
| Control (n = 26) | Patient before treatment (n = 30) | Patient 3 months after treatment (n = 30) | Control 3 months after follow-up | |
|---|---|---|---|---|
| E-selectin: endothelial selectin; sICAM-1: soluble intercellular adhesion molecule; hs-CRP: high-sensitivity C-reactive protein. aP < 0.001 patient vs. control group at baseline. bP < 0.05 patient vs. control group at the 3-month follow-up. *P < 0.001, **P < 0.05 pre- vs. post-treatment in the patient group. | ||||
| E-selectin (ng/mL) | 78.66 ± 24.74 | 99.74 ± 34.67a | 89.15 ± 30.50* | 81.3 ± 26.3 |
| sICAM-1 (ng/mL) | 387.5 ± 113.5 | 568.8 ± 149.0a | 490.2 ± 133.0* | 422 ± 123.2b |
| Endothelin (fmol/mL) | 0.69 ± 0.33 | 0.62 ± 0.33 | 0.55 ± 0.20 | 0.62 ± 0.21 |
| hs-CRP (mg/L) | 1.07 ± 0.79 | 21.30 ± 39.10a | 3.01 ± 0.83** | 2.2 ± 0.81b |
| Control (n = 26) | Patient before treatment (n = 30) | Patient after treatment (n = 30) | Control 3 month follow-up | |
|---|---|---|---|---|
| *P < 0.01, **P < 0.05, patient group pre- vs. post-stimulation. FMD: flow-mediated dilatation. | ||||
| Basal brachial artery diameter (mm) | 3.86 ± 0.43 | 3.67 ± 0.60 | 3.87 ± 0.71 | 3.9 ± 0.92 |
| Artery diameter after stimulation (mm) | 4.06 ± 0.44 | 382 ± 0.59 | 4.15 ± 0.70* | 4.4 ± 0.75 |
| FMD (%) | 5.33 ± 5.57 | 4.86 ± 4.76 | 7.60 ± 6.23** | 6.9 ± 5.6 |
| E-selectin | Before treatment | After treatment | ||
|---|---|---|---|---|
| Correlation factor (r) | P value | Correlation factor (r) | P value | |
| *P < 0.05. sICAM-1: soluble intracellular adhesion molecule-1; hs-CRP: high-sensitivity C-reactive protein; LDL: low-density lipoprotein; FMD: flow-mediated dilatation. | ||||
| %FMD change | -0.452 | 0.012* | -0.341 | 0.065 |
| sICAM-1 | 0.434 | 0.016* | 0.278 | 0.142 |
| Endothelin | 0.132 | 0.488 | 0.297 | 0.111 |
| hs-CRP | 0.078 | 0.682 | 0.099 | 0.601 |
| Total-cholesterol | 0.367 | 0.046* | 0.347 | 0.060 |
| LDL-cholesterol | 0.385 | 0.036* | 0.429 | 0.018* |
| Triglyceride | 0.058 | 0.763 | -0.101 | 0.596 |