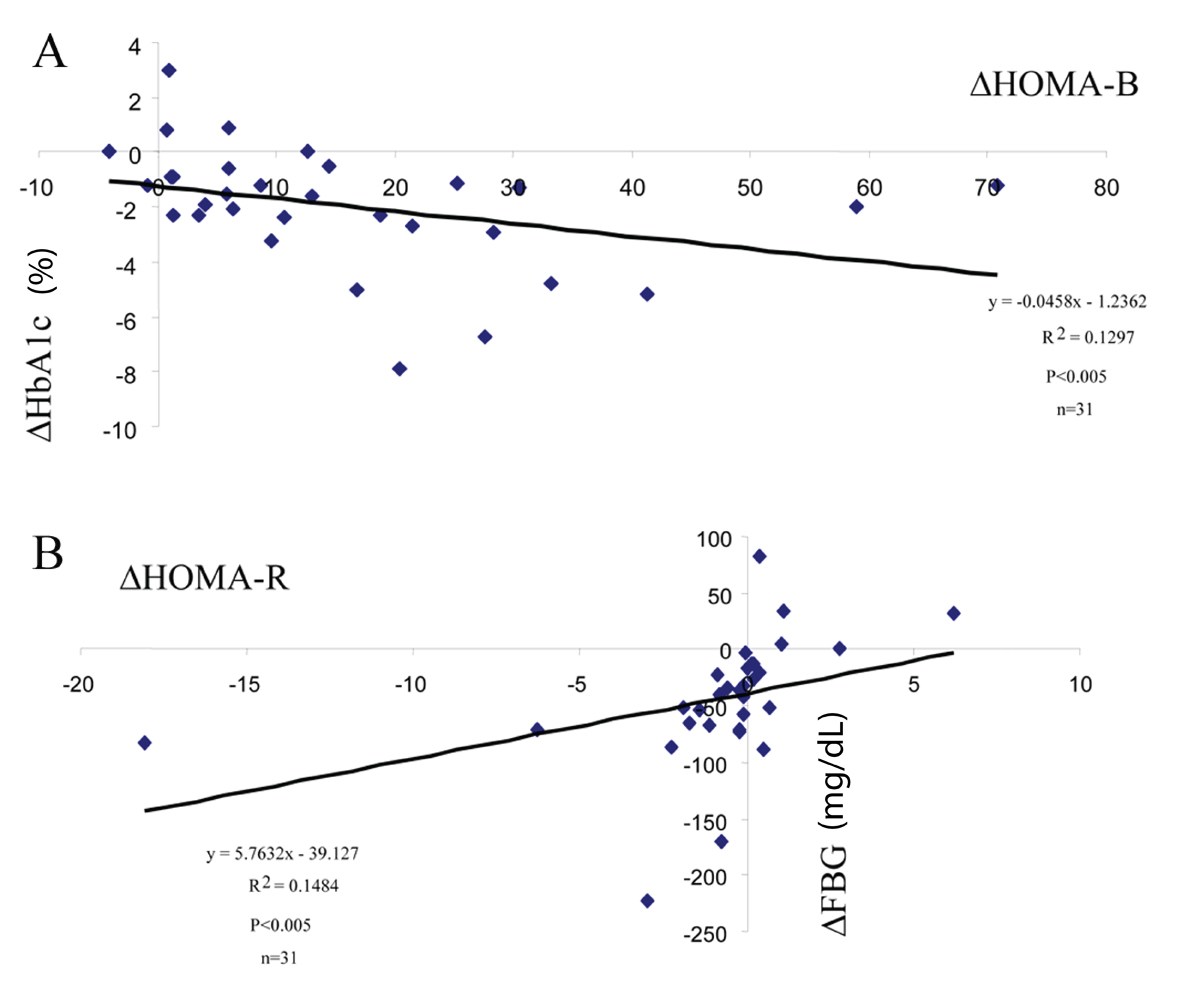
Figure 1. Baseline-dependent glucose lowering efficacy of teneligliptin. Simple regression analysis was performed between the changes of (Δ) HbA1c and baseline HbA1c levels.
| Journal of Clinical Medicine Research, ISSN 1918-3003 print, 1918-3011 online, Open Access |
| Article copyright, the authors; Journal compilation copyright, J Clin Med Res and Elmer Press Inc |
| Journal website http://www.jocmr.org |
Original Article
Volume 6, Number 4, August 2014, pages 287-294
Teneligliptin As an Initial Therapy for Newly Diagnosed, Drug Naive Subjects With Type 2 Diabetes
Figure

Tables
| Baseline | 3 months | P values | |
|---|---|---|---|
| Paired Student’s t-test was used to compare the changes of the indicated parameters before and after treatment. The results are expressed as the mean ± SD. | |||
| Age | 58.29 ± 14.95 | ||
| HbA1c (%NGSP) | 10.34 ± 2.06 | 8.38 ± 2.23 | < 0.00001 |
| FBG (mg/dL) | 211.3 ± 68.4 | 167.3 ± 70.2 | < 0.0002 |
| Insulin (μU/mL) | 7.68 ± 9.24 | 7.55 ± 5.15 | n.s. |
| HOMA-R | 3.74 ± 4.28 | 2.90 ± 2.16 | n.s. |
| HOMA-B | 24.04 ± 31.14 | 40.23 ± 40.98 | < 0.00001 |
| T-C (mg/dL) | 218.3 ± 33.4 | 217.2 ± 38.9 | n.s. |
| TG (mg/dL) | 126.7 ± 46.8 | 128.0 ± 66.4 | n.s. |
| HDL-C (mg/dL) | 56.4 ± 15.4 | 57.2 ± 15.9 | n.s. |
| Non-HDL-C (mg/dL) | 161.8 ± 32.3 | 159.9 ± 39.0 | n.s. |
| LDL-C (mg/dL) | 140.2 ± 30.9 | 141.1 ± 32.7 | n.s. |
| FFA (mEq/dL) | 0.754 ± 0.361 | 0.676 ± 0.253 | n.s. |
| UA (mg/dL) | 4.69 ± 1.41 | 5.15 ± 1.55 | < 0.05 |
| BMI | 23.90 ± 4.61 | 23.90 ± 3.99 | n.s. |
| Coefficient | Standard error | t | P | R2 | |
|---|---|---|---|---|---|
| Dependent variables: changes of HbA1c levels. Independent variables: age, baseline values of HbA1c, FBG, insulin, HOMA-R, HOMA-B, TG, non-HDL, LDL-C, UA and BMI. | |||||
| 2.2249 | 6.7479 | 0.32972 | 0.74542 | 0 | |
| Age | -0.018583 | 0.03449 | -0.5388 | 0.59662 | 0.0041531 |
| Baseline HbA1c | -0.69467 | 0.28351 | -2.4502 | 0.024733 | 0.20841 |
| FBG | 0.010769 | 0.013359 | 0.80615 | 0.43068 | 0.00029303 |
| Insulin | 0.35054 | 0.7305 | 0.47986 | 0.63711 | 0.039977 |
| HOMA-R | -0.79265 | 1.1315 | -0.70054 | 0.49254 | 0.039729 |
| HOMA-B | -0.021344 | 0.084418 | -0.25283 | 0.80326 | 0.030499 |
| TG | 0.02177 | 0.015404 | 1.4133 | 0.17462 | 0.017047 |
| HDL-C | 0.027854 | 0.043685 | 0.6376 | 0.53176 | 0.026703 |
| Non-HDL-C | -0.047243 | 0.048644 | -0.97121 | 0.34431 | 0.037563 |
| LDL-C | 0.047284 | 0.048906 | 0.96684 | 0.34644 | 0.075844 |
| UA | -0.33518 | 0.40987 | -0.81776 | 0.42419 | 0.013704 |
| BMI | 0.035169 | 0.20015 | 0.17571 | 0.86248 | 0.023904 |