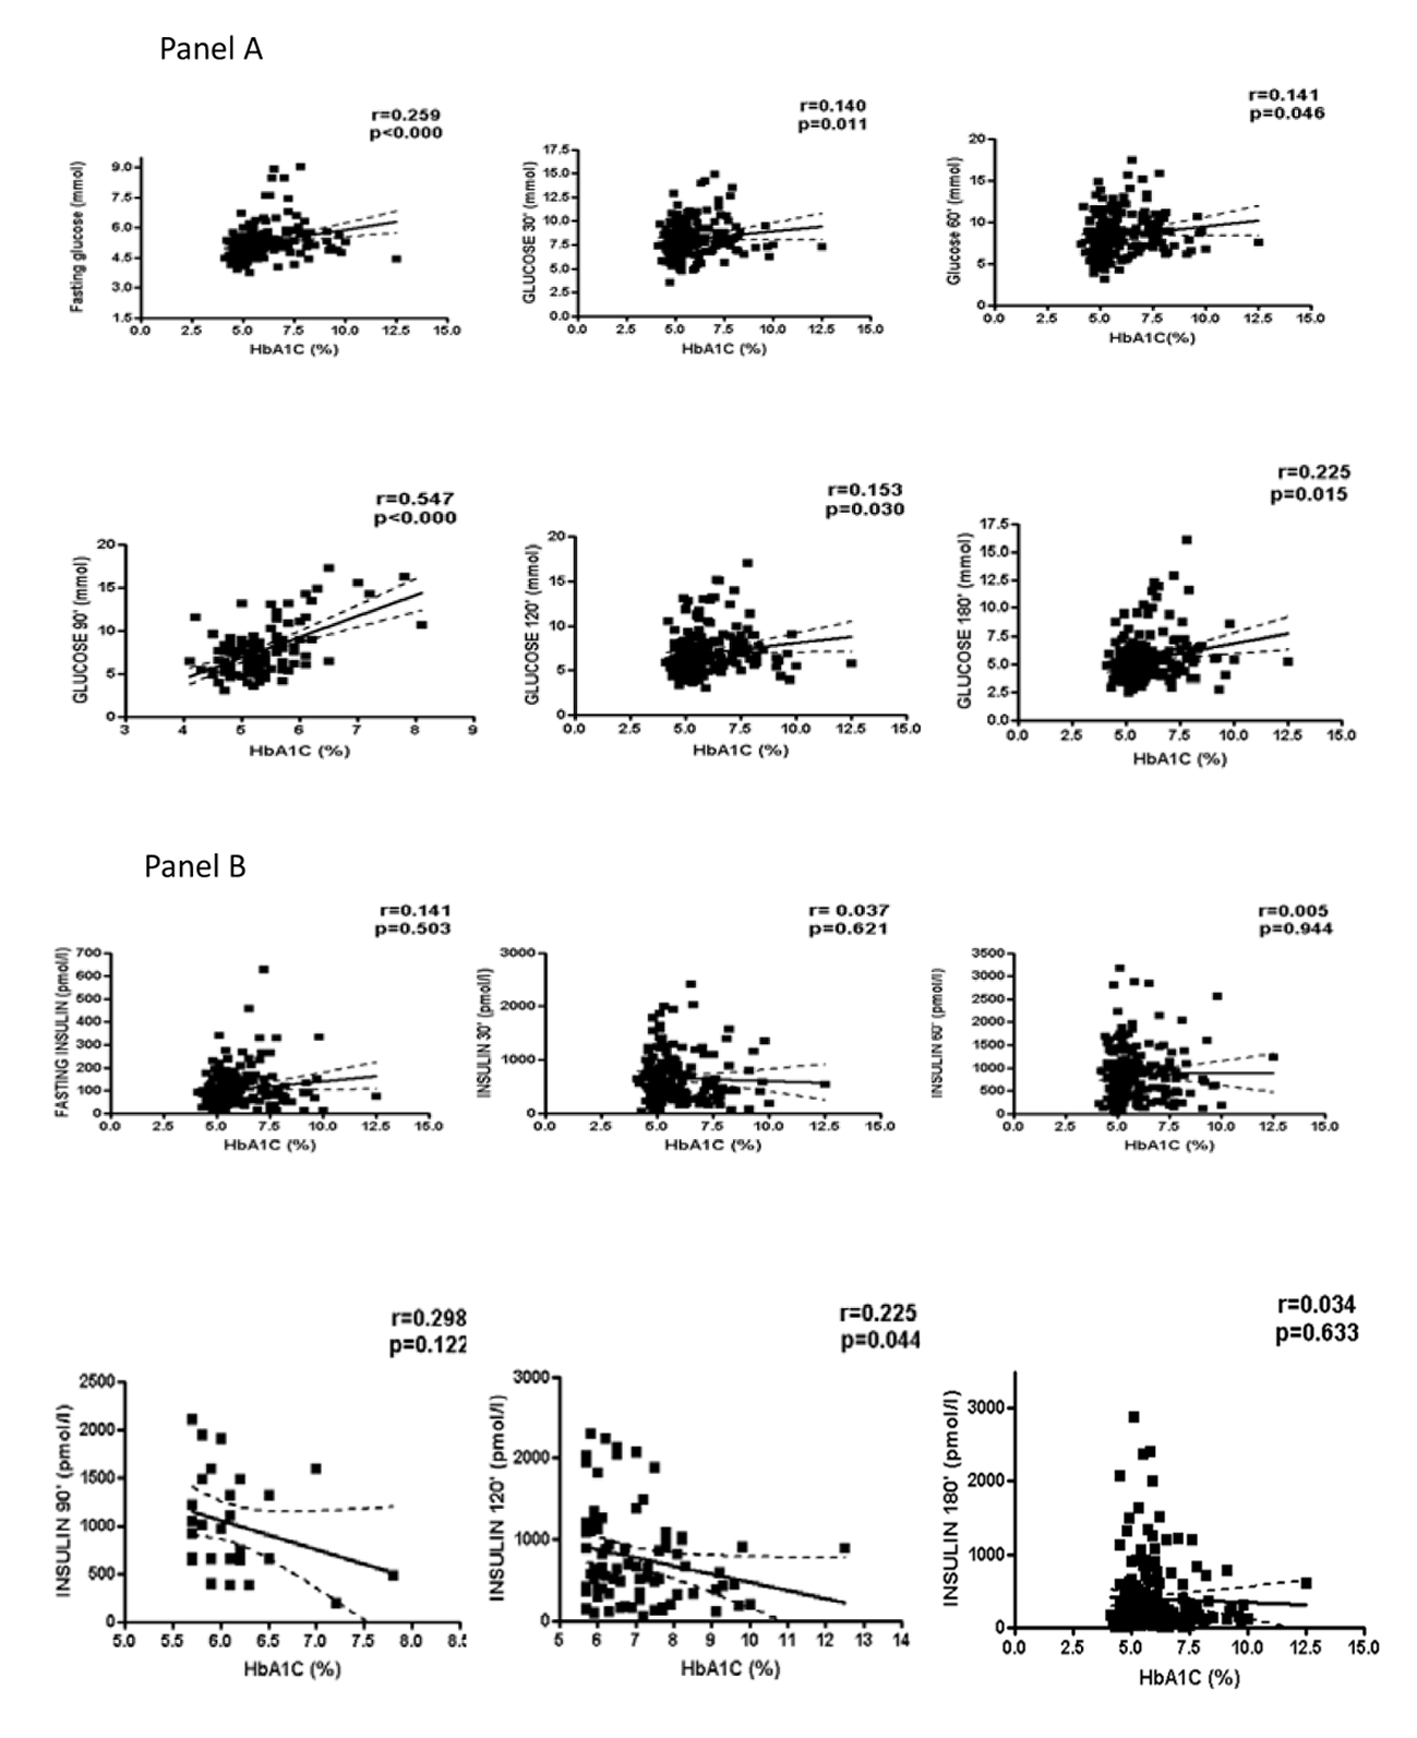
Figure 1. Correlation of glycated hemoglobin (HbA1c) with glucose and insulin.
| Journal of Clinical Medicine Research, ISSN 1918-3003 print, 1918-3011 online, Open Access |
| Article copyright, the authors; Journal compilation copyright, J Clin Med Res and Elmer Press Inc |
| Journal website http://www.jocmr.org |
Original Article
Volume 6, Number 4, August 2014, pages 278-286
Prevalence of Elevated Glycated Hemoglobin Concentrations in the Polycystic Ovary Syndrome: Anthropometrical and Metabolic Relationship in Amazonian Women
Figure
Tables
| Parameters | N (288) | % |
|---|---|---|
| *One or more clinical feature per patient. | ||
| Age (years) | ||
| 14 - 19 | 28 | 9.72 |
| 20 - 24 | 64 | 22.22 |
| 25 -29 | 100 | 34.72 |
| 30 - 34 | 76 | 26.38 |
| 35 - 39 | 17 | 5.90 |
| ≥ 40 | 3 | 1.04 |
| Social habits | ||
| Etilism | 81 | 28.12 |
| Smoking | 18 | 6.25 |
| None | 189 | 65.62 |
| Physical activity | ||
| Walking | 41 | 14.23 |
| Biking | 1 | 0.34 |
| Other | 4 | 1.39 |
| None | 230 | 79.87 |
| Not recorded | 12 | 4.17 |
| Clinical features | ||
| Infertility | 148 | 51.38 |
| Amenorrhea | 57 | 19.79 |
| Oligomenorrhea | 166 | 57.63 |
| Polymenorrhea | 16 | 5.55 |
| Acne | 126 | 43.75 |
| Hirsutism | 149 | 51.73 |
| Acanthosis nigricans | 67 | 23.26 |
| Striaes | 17 | 5.90 |
| Ultrasound features | ||
| Normal ovary | 56 | 19.44 |
| Polycystic ovary | 232 | 80.56 |
| Variable | n/N | % | Test Z | P* |
|---|---|---|---|---|
| *P, two-tailed Z proportion test. | ||||
| BMI (kg/m2) | ||||
| < 30 | 147/264 | 56.68 | ||
| ≥ 30 | 117/264 | 44.32 | 2.611 | 0.009 |
| Fat mass (%) | ||||
| < 32 | 146/265 | 55.10 | ||
| > 32 | 119/265 | 44.90 | 2.345 | 0.018 |
| Waist (cm) | ||||
| < 88 | 129/254 | 50.79 | ||
| ≥ 88 | 125/254 | 49.21 | 0.354 | 0.726 |
| W:H ratio | ||||
| < 0.80 | 191/252 | 75.80 | ||
| ≥ 0.80 | 61/252 | 24.20 | 11.581 | 0.000 |
| Conicity index | ||||
| < 1.25 | 112/150 | 74.67 | ||
| ≥ 1.25 | 38/150 | 25.33 | 8.544 | 0.000 |
| Variable | HbA1c | Total (n) | PR* (95% CI) | P** | |
|---|---|---|---|---|---|
| ≥ 5.7 (n) | < 5.7 (n) | ||||
| *PR: prevalence ratio. **P, two-tailed Z proportion test. | |||||
| Fasting glucose (nmol/L) | |||||
| ≥ 5.55 | 35 | 13 | 48 | ||
| < 5.55 | 76 | 158 | 234 | 2.24 (1.68 - 2.76) | 0 |
| Total | 111 | 171 | 282 | ||
| Fasting insulin (nmol/L) | |||||
| ≥ 85 | 69 | 73 | 142 | ||
| < 85 | 37 | 86 | 123 | 1.61 (1.16 - 2.27) | 0.003 |
| Total | 106 | 159 | 265 | ||
| Pep-C (nmol/L) | |||||
| ≥ 1.17 | 26 | 17 | 43 | ||
| < 1.17 | 60 | 112 | 172 | 1.73 (1.19 - 2.32) | 0.003 |
| Total | 86 | 129 | 215 | ||
| HOMA-IR | |||||
| ≥ 2.8 | 31 | 26 | 57 | ||
| < 2.8 | 75 | 127 | 202 | 1.46 (1.04 - 1.95) | 0.022 |
| Total | 106 | 153 | 259 | ||
| HOMA % β | |||||
| ≥ 155 | 41 | 52 | 93 | ||
| < 155 | 65 | 101 | 166 | 1.12 (0.81 - 1.53) | 0.510 |
| Total | 106 | 153 | 259 | ||
| Age (years) | BMI ≥ 30 (n) | BMI < 30 (n) | Total (n) | χ2mh | P |
|---|---|---|---|---|---|
| χ2mh: Mantel-Haenszel qui-square. | |||||
| HbA1c < 5.7% | |||||
| < 30 | 18 | 31 | 49 | ||
| ≥ 30 | 35 | 78 | 113 | 0.512 | 0.474 |
| Total | 53 | 109 | 162 | ||
| HbA1c ≥ 5.7% | |||||
| < 30 | 31 | 10 | 41 | ||
| ≥ 30 | 33 | 28 | 61 | 4.806 | 0.028 |
| Total | 64 | 38 | 102 | ||
| Total | |||||
| < 30 | 49 | 41 | 90 | ||
| ≥ 30 | 68 | 106 | 174 | 5.653 | 0.017 |
| Total | 117 | 147 | 264 | ||