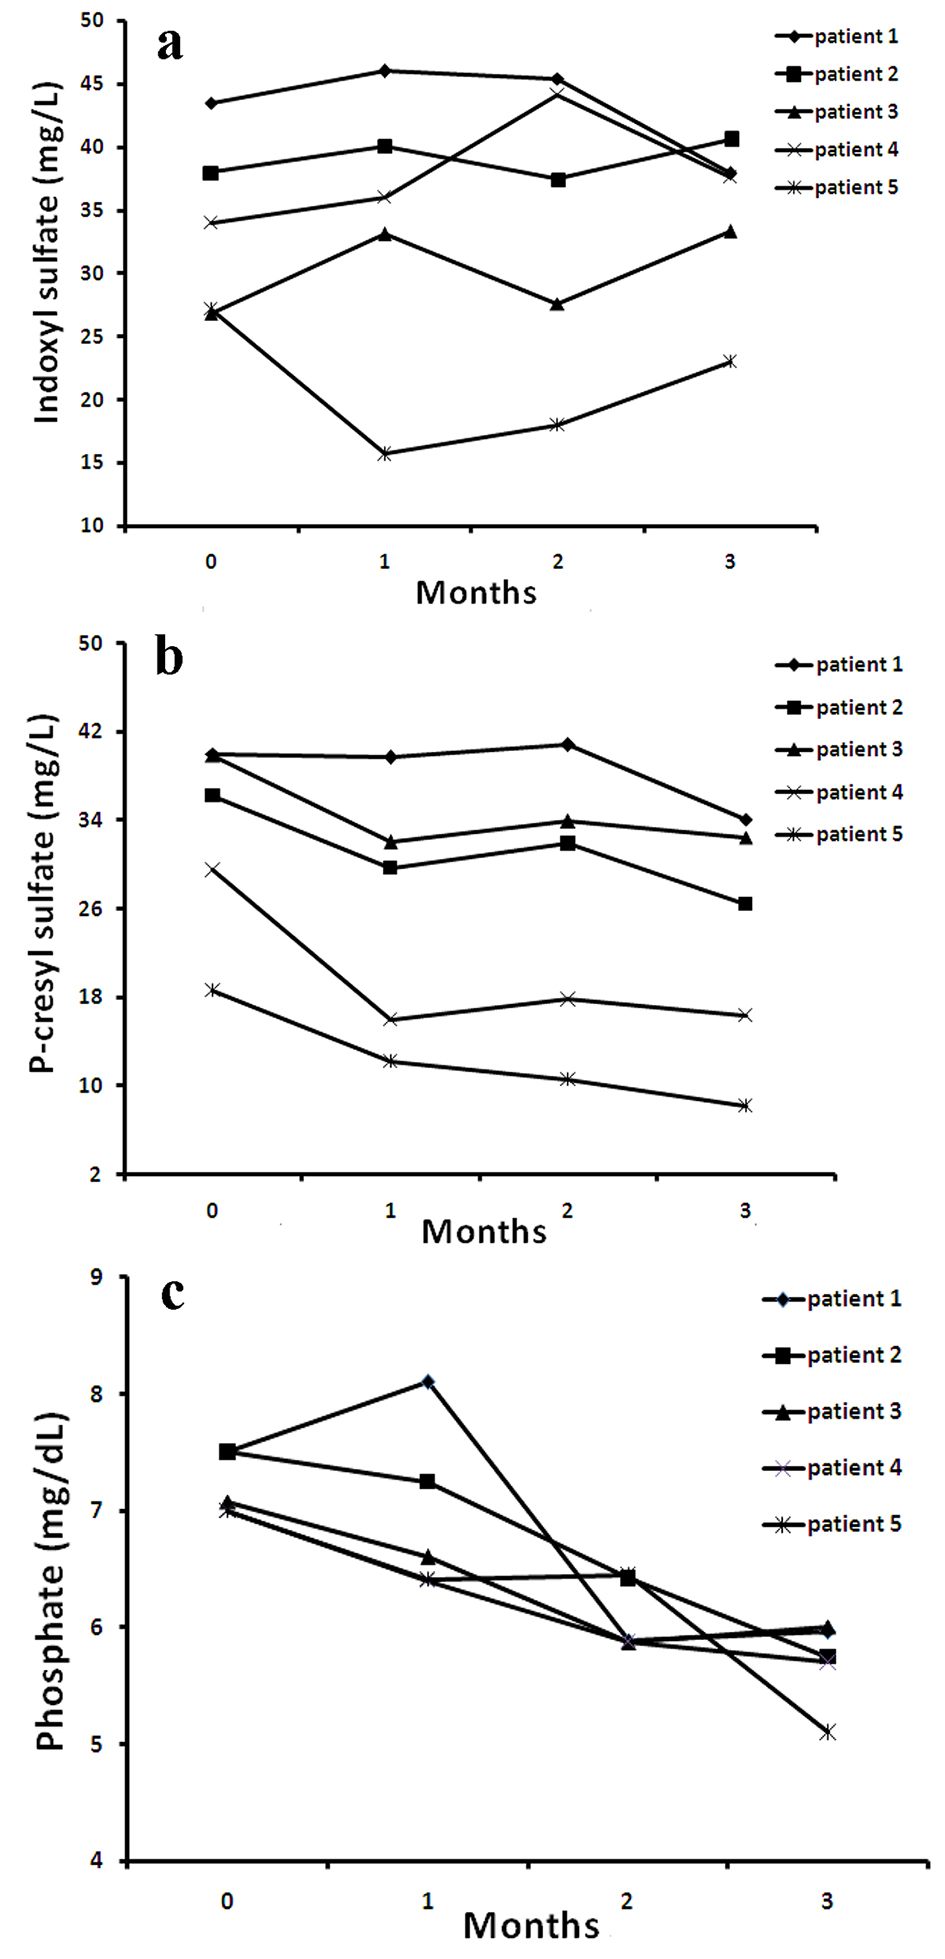
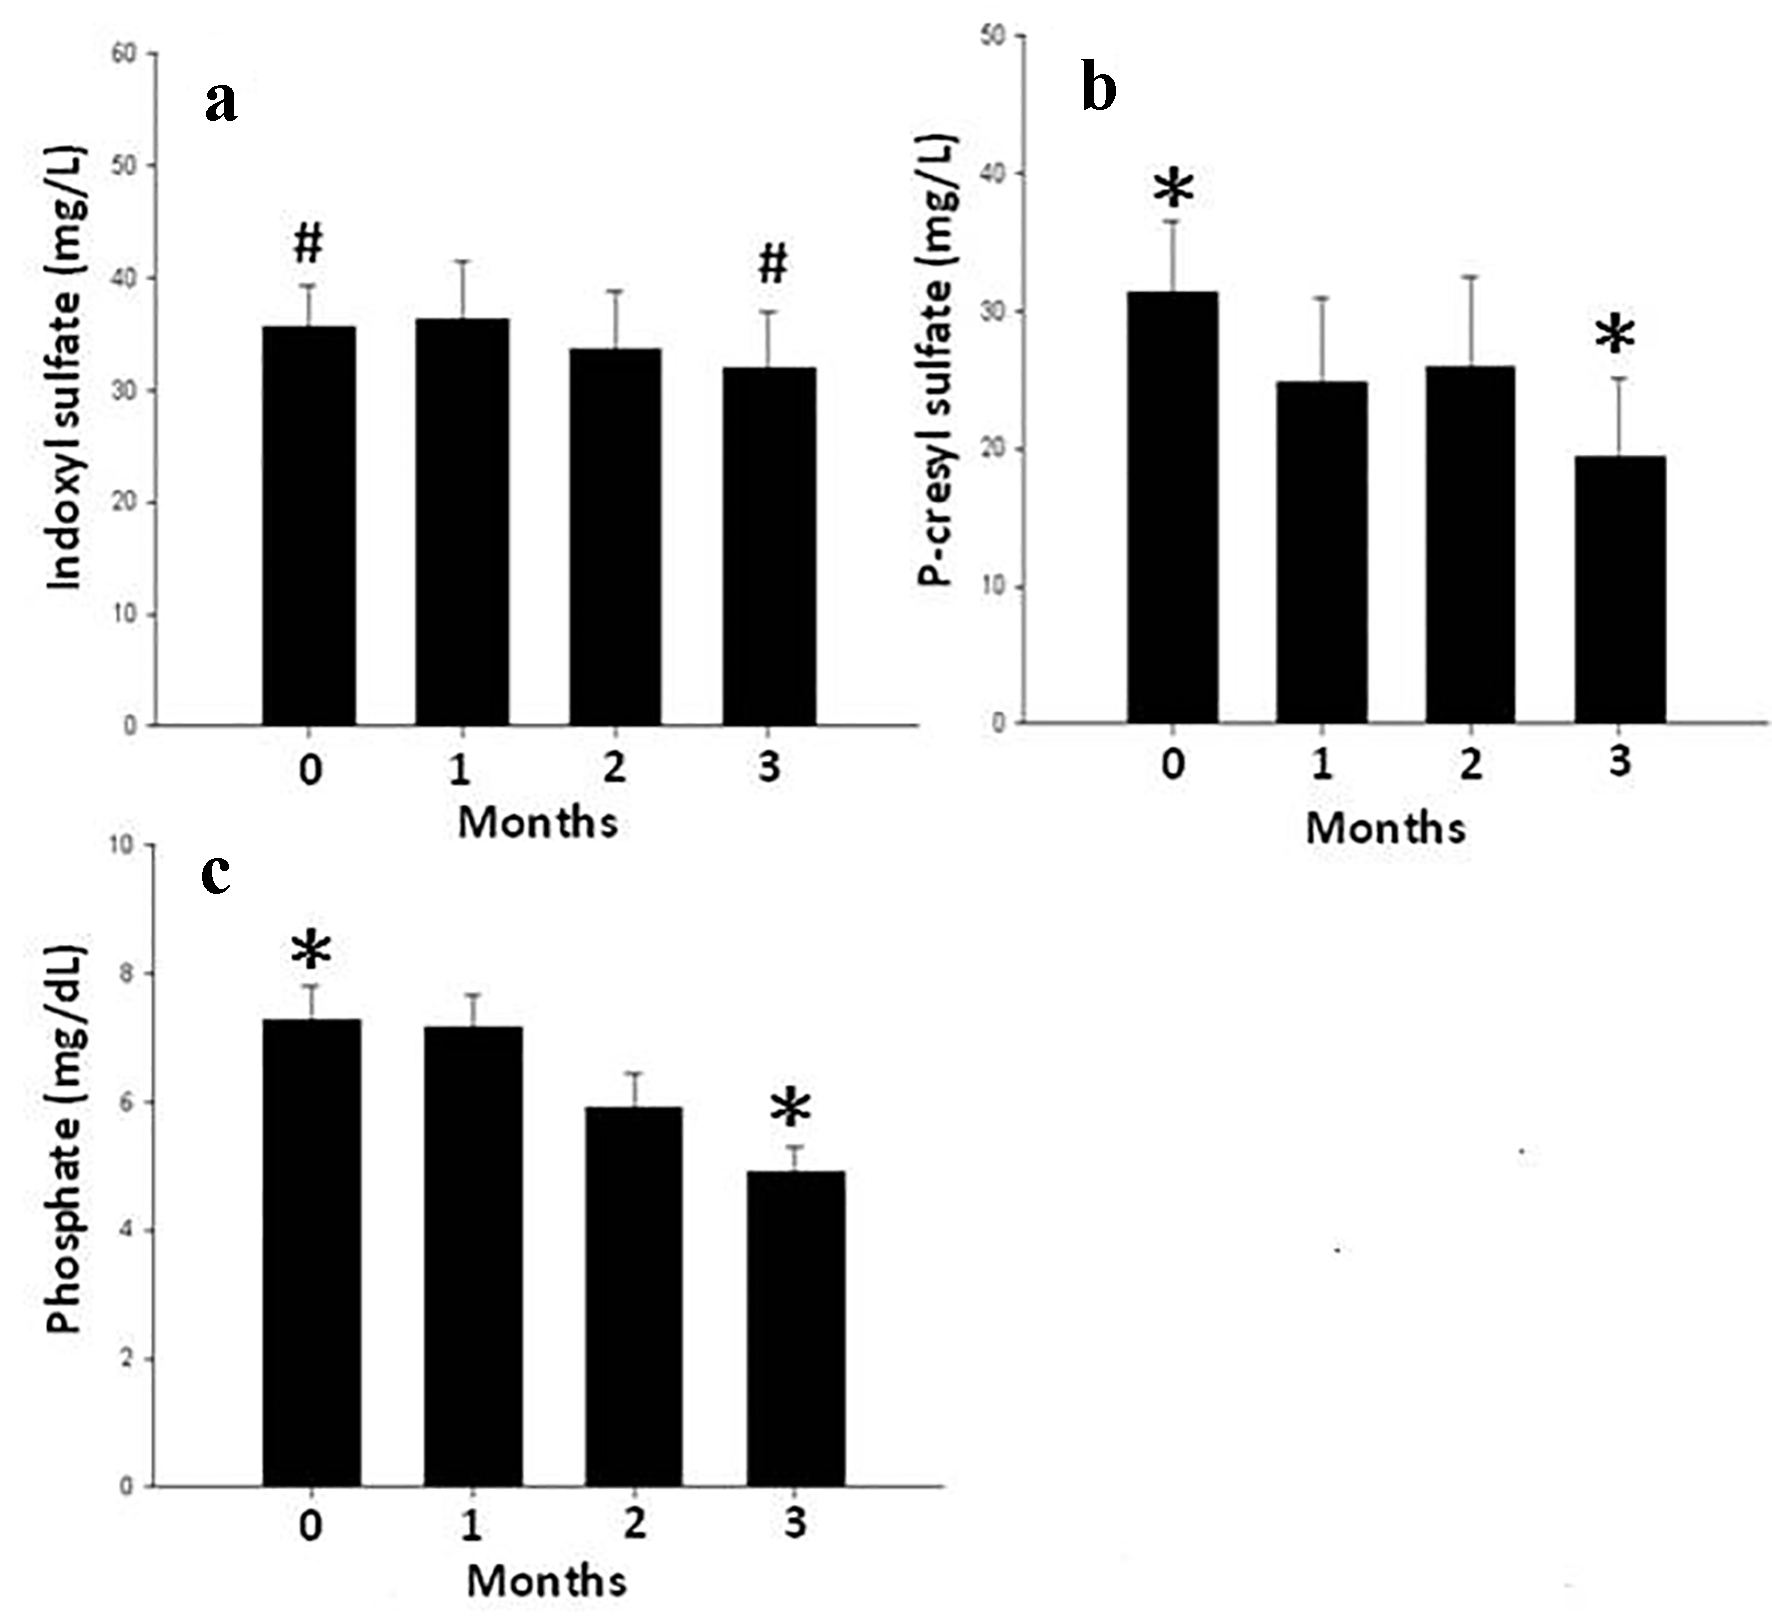
Figure 1. The distribution of serum IS (a), PCS (b) and phosphate (c) levels at 0, 1, 2, 3 months after SH treatment for all HD patients.
| Journal of Clinical Medicine Research, ISSN 1918-3003 print, 1918-3011 online, Open Access |
| Article copyright, the authors; Journal compilation copyright, J Clin Med Res and Elmer Press Inc |
| Journal website http://www.jocmr.org |
Original Article
Volume 9, Number 9, September 2017, pages 765-770
Effects of Sevelamer Hydrochloride on Uremic Toxins Serum Indoxyl Sulfate and P-Cresyl Sulfate in Hemodialysis Patients
Figures
Tables
| Variables | HD patients (n = 5) | P-value | |
|---|---|---|---|
| Before treatment | After treatment | ||
| Age (years) | 46 ± 6.3 | ||
| Man | 20% | ||
| Time of dialysis (years) | 5.3 ± 1.1 | ||
| cGN | 100% | ||
| Kt/V | 1.5 ± 0.1 | 1.6 ± 0.1 | NS |
| SBP (mm Hg) | 138.4 ± 13.2 | 135.2 ± 12.9 | NS |
| DBP (mm Hg) | 88.6 ± 6.9 | 90 ± 7.5 | NS |
| Hb (g/L) | 11.4 ± 2.1 | 11.7 ± 2.2 | NS |
| Ht (%) | 34.1 ± 6.2 | 35.3 ± 6.5 | NS |
| CO2 (mmol/L) | 22.2 ± 1.3 | 21.9 ± 1.4 | NS |
| Glucose (AC) | 86.0 ± 8.2 | 89 ± 8.3 | NS |
| Albumin (g/dL) | 4.0 ± 0.3 | 4.1 ± 0.3 | NS |
| ALK-P (IU/L) | 301.0 ± 216.8 | 275 ± 139.6 | NS |
| GOT (IU/L) | 14.8 ± 6.3 | 14.2 ± 6.1 | NS |
| GPT (IU/L) | 13.0 ± 4.7 | 13.6 ± 4.3 | NS |
| T-chol (mg/dL) | 151.0 ± 37.4 | 119.2 ± 29.4 | 0.02 |
| TG (mg/dL) | 110.4 ± 48.0 | 95 ± 17.6 | NS |
| Uric acid (mg/dL) | 7.7 ± 1.2 | 7.5 ± 1.3 | NS |
| BUN (mg/dL) | 86.0 ± 25.1 | 91.4 ± 27.4 | NS |
| Creatinine (mg/dL) | 10.9 ± 2.0 | 10.7 ± 2.1 | NS |
| K (mEq/L) | 5.3 ± 0.6 | 5.5 ± 0.8 | NS |
| Na (mEq/L) | 138.6 ± 1.5 | 136.7 ± 1.4 | NS |
| P (mg/dL) | 7.2 ± 0.7 | 5.4 ± 0.5 | < 0.01 |
| Ca (mg/dL) | 9.7 ± 0.5 | 9.1 ± 0.4 | 0.01 |
| i-PTH (pg/mL) | 984.8 ± 346.2 | 839.5 ± 295.1 | NS |
| IS (mg/L) | 35.4 ± 8.5 | 32.1 ± 8.1 | NS |
| PCS (mg/L) | 31.3 ± 10.6 | 19.7 ± 10.5 | < 0.01 |
| F | df | P-value | |
|---|---|---|---|
| IS | 1.64 | 1 | 0.271 |
| PCS | 28.91 | 1 | 0.021 |
| Phosphate | 53.55 | 1 | 0.001 |