Journal of Clinical Medicine Research, ISSN 1918-3003 print, 1918-3011 online, Open Access
Article copyright, the authors; Journal compilation copyright, J Clin Med Res and Elmer Press Inc
Journal website http://www.jocmr.org

Original Article

Volume 6, Number 2, April 2014, pages 138-144


Is a Switch From Insulin Therapy to Liraglutide Possible in Japanese Type 2 Diabetes Mellitus Patients?/b>

Figure

Figure 1.
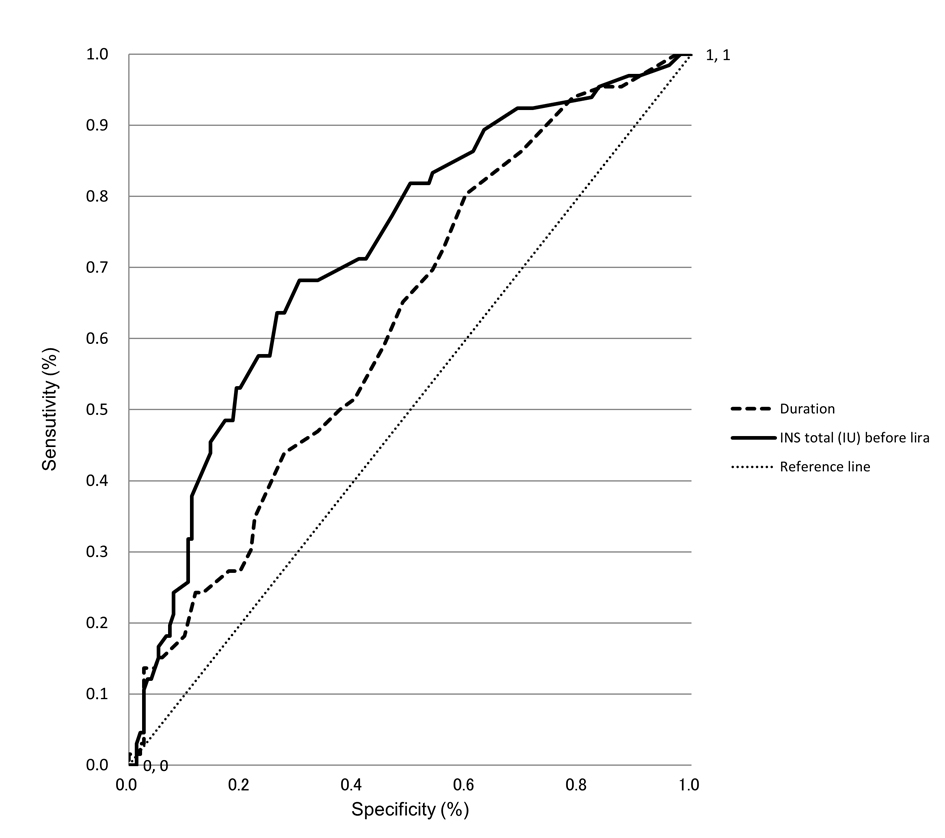
Figure 1. ROC curve analyses to identify predictors of continuing lira therapy. ROC curves of duration and total insulin dose before start of liraglutide therapy as covariates in the prediction of 6-month continuation of lira therapy are shown. The higher the area under the curve (namely, the greater the curvature away from the 50% line (zero prediction)), the greater the predictive power.

Tables

Table 1. Characteristics of the Enrolled Population and Subject Disposition
 
Liraglutide continuation groupLiraglutide discontinuation groupP value
n = 161n = 70
Data are means ± SD or n (%), N (number) unless otherwise noted. SBP: systolic blood pressure; DBP: diastolic blood pressure; Cr: creatinine; TC: total cholesterol; LDL: low-density lipoprotein; HDL: high-density lipoprotein; TG: triglycerides; BMI: body mass index; BW: body weight; BOT: basal oral therapy; OAD: oral antidiabetic agents; SU: sulfonylurea; BG: biguanide; TZD: thiazolidine; αGI: α-glucosidase inhibitor.
Sex: male/female (%)58/4262/38P > 0.05
Age (years)60 ± 1160 ± 11P > 0.05
Duration of diabetes (years)11 ± 814 ± 9P < 0.01
SBP (mmHg)128 ± 17124 ± 14P > 0.05
DBP (mmHg)74 ± 1272 ± 11P > 0.05
Cr (mg/dL)0.82 ± 0.310.85 ± 0.31P > 0.05
TC (mg/dL)183 ± 31191 ± 33P > 0.05
LDL (mg/dL)107 ± 29104 ± 29P > 0.05
HDL (mg/dL)54 ± 1355 ± 19P > 0.05
TG (mg/dL)147 ± 82175 ± 184P > 0.05
BMI (kg/m2)26.1 ± 4.926.8 ± 5.0P > 0.05
ΔBW (0 - 12 weeks)-1.6 ± 2.8-0.8 ± 2.9P < 0.001
HbA1c (%, mmol/mol)7.3 ± 1.2, 56 ± 13.18.0 ± 1.4, 64 ± 15.3P < 0.01
ΔHbA1c (0 - 12 weeks) (%, mmol/mol)-0.4 ± 0.3, -4.4 ± 3.30.6 ± 0.9, 6.6 ± 9.8P < 0.001
Insulin therapy (BOT/Premix/Basal bolus) (%)27/13/6020/6/74P > 0.05
Total insulin dose (U/day)18 ± 1529 ± 17P < 0.001
Prestudy OAD treatment (n)
SU/BG/TZD/αGI/glinide/none28/24/15/27/14/9611/13/6/7/3/46P > 0.05


Table 2. Predictors of ΔHbA1c and ΔBW in the Liraglutide Therapy Groups on Multiple Regression Analysis
 
Predictors of ΔHbA1c 0 - 12 weeksPredictors of ΔBW 0 - 12 weeks
βPβP
BMI, body mass index.
Age-0.0340.665-0.1020.190
Sex-0.0620.3960.0610.425
Duration-0.0150.839-0.0240.749
BMI0.0320.704-0.0520.539
Basal HbA1c-0.201< 0.01-0.0840.339
Total insulin dose0.018< 0.001-0.068< 0.001


Table 3. Logistic Regression Analysis With Advisability of Continuing Liraglutide Therapy to 6 Months as the Dependent Variable
 
OR95% CIP value
Duration1.041.005 to 1.0760.024
Total insulin dose1.041.016 to 1.056< 0.001