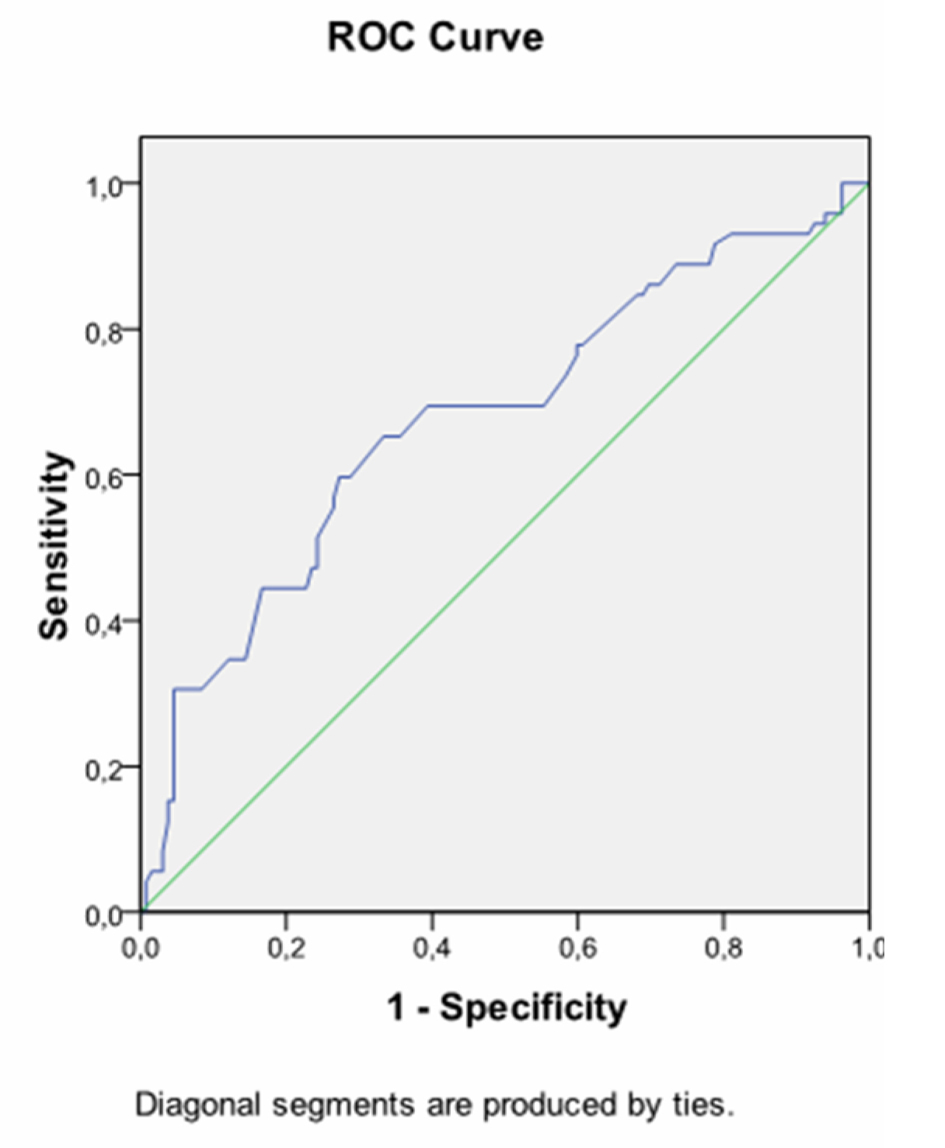
Figure 1. Receiver operating characteristic curve (ROC) exhibiting fasting plasma glucose during OGTT at prediction of insulin requirement. AUC 0.734, cutofflevel: 89.5 mg/dL, Sensitivity: 72.7% Specifity: 62.6%, P = 0.001.
| Journal of Clinical Medicine Research, ISSN 1918-3003 print, 1918-3011 online, Open Access |
| Article copyright, the authors; Journal compilation copyright, J Clin Med Res and Elmer Press Inc |
| Journal website http://www.jocmr.org |
Original Article
Volume 5, Number 5, October 2013, pages 381-388
Risk Factors That can Predict Antenatal Insulin Need in Gestational Diabetes
Figure
Tables
| Factors | Patients with MNT only (n = 190) | Patients with AIT (n = 110) | P | |
|---|---|---|---|---|
| MNT: medical Nutrition Therapy; AIT: Antenatal insulin treatment; Mean ± Standard deviation, Median (Minimum-Maximum). | ||||
| Pregestational Factors | positive family history (n) | 88 (46.3%) | 64 (58.2) | 0.031 |
| pregestational BMI (kg/m2) | 26.2 ± 4.3 | 27.7 ± 5.5 | 0.122 | |
| Parity | 2 (1 - 8) | 2 (1 - 8) | 0.805 | |
| history of GDM (n) | 46 (24.2%) | 32 (29%) | 0.391 | |
| macrosomic baby birth history (n) | 11 (6.2%) | 10 (%9.8) | 0.190 | |
| Gestational Factors | age (year) | 32.9 ± 4.6 | 32.9 ± 4.9 | 0.914 |
| diagnosis time (gestational week) | 26.1 ± 5.1 | 27.6 ± 4.4 | 0.008 | |
| BMI at diagnosis (kg/m2) | 30.2 ± 4.6 | 31.6 ± 4.9 | 0.049 | |
| weight gain until diagnosis (kg) | 9.2 (0 - 16.2) | 8.6 (2 - 18.3) | 0.945 | |
| systolic blood pressure during diagnosis (mmHg) | 114.5 ± 8.8 | 113.6 ± 5.9 | 0.532 | |
| diastolic blood pressure during diagnosis (mmHg) | 69.2 ± 7.9 | 69.0 ± 7.9 | 0.089 | |
| HbA1C during diagnosis (%) | 5.3 ± 0.6 | 5.6 ± 0.6 | 0.001 | |
| Fasting plasma glucose during OGTT (mg/dL) | 87.5 ± 11.2 | 97.3 ± 12.1 | 0.0001 | |
| B | S.E. | Wald | df | P | Odd Ratio | 95% C.I. for EXP(B) | ||
|---|---|---|---|---|---|---|---|---|
| Lower | Upper | |||||||
| a. Variable(s) entered on step 1 positive family history, time of diagnosis (gestational week), BMI at diagnosis, HbA1C at time of diagnosis, Fasting plasma glucose on OGTT. | ||||||||
| positive family history | 0.351 | 0.367 | 0.918 | 1 | 0.338 | 1.421 | 0.692 | 2.916 |
| Diagnosis time (gestational week) | -0.046 | 0.044 | 1.115 | 1 | 0.291 | 0.955 | 0.876 | 1.040 |
| BMI at diagnosis | 0.026 | 0.038 | 0.458 | 1 | 0.499 | 1.026 | 0.952 | 1.106 |
| HbA1C during diagnosis | 0.680 | 0.316 | 4.635 | 1 | 0.031 | 1.974 | 1.063 | 3.666 |
| Fasting plasma glucose at OGTT | 0.062 | 0.016 | 14.947 | 1 | 0.0001 | 1.064 | 1.031 | 1.098 |
| Constant | -9.682 | 2.665 | 13.203 | 1 | 0.0001 | 0.000 | ||
| Value | 95% Confidence Interval | ||
|---|---|---|---|
| Lower | Upper | ||
| Odds ratio for fasting plasma glucose (89.5 mg/dL) | 4.469 | 2.678 | 7.460 |
| Odds ratio for HbA1C (5.485%) | 3.760 | 2.053 | 6.887 |