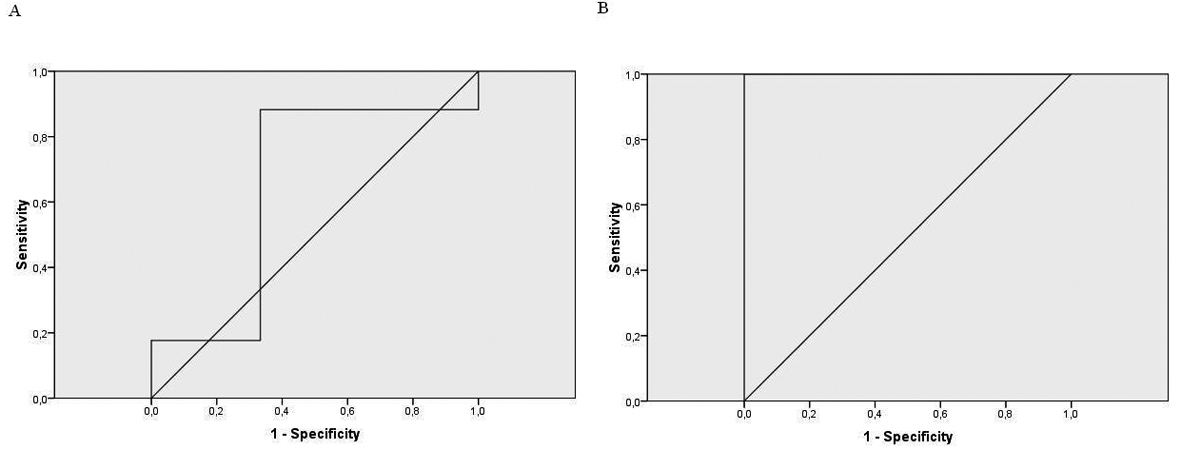
Figure 1. A: the ROC curve for the 1st conductivity test; B: the ROC curve for the 2nd conductivity test.
| Journal of Clinical Medicine Research, ISSN 1918-3003 print, 1918-3011 online, Open Access |
| Article copyright, the authors; Journal compilation copyright, J Clin Med Res and Elmer Press Inc |
| Journal website http://www.jocmr.org |
Original Article
Volume 5, Number 1, February 2013, pages 34-41
Nanoduct Sweat Conductivity Measurements in 2664 Patients: Relationship to Age, Arterial Blood Gas, Serum Electrolyte Profiles and Clinical Diagnosis
Figure

Tables
| 2nd conductivity test (mmol/L) | |||||
|---|---|---|---|---|---|
| 3 - 60 Normal | 61 - 80 Intermediate | > 80 Positive | |||
| 3 - 60 Normal | 2,588 | 35 | 0 | 1 (1 CF) | |
| 1st conductivity test (mmol/L) | 61 - 80 Intermediate | 0 | 17 | 6 (4 CF) | 1 (1 CF) |
| > 80 Positive | 0 | 4 | 1 | 11 (11 CF) | |
| All Ages (n) | 0 - 6 months | 7 - 12 months | 13 - 24 months | > 24 months | ||||||
|---|---|---|---|---|---|---|---|---|---|---|
| Male (n) | Female (n) | Male (n) | Female (n) | Male (n) | Female (n) | Male (n) | Female (n) | |||
| Mean ± SD | 34.26 ± 10.34 | 34.58 ± 14.34 | 34.79 ± 11.47 | 32.86 ± 9.83 | 32.18 ± 8.44 | 33.47 ± 8.75 | 33.33 ± 8.14 | 35.38 ± 10.07 | 35.61 ± 9.15 | |
| 1st conductivity test, mmol/L | (2,664) | (366) | (206) | (337) | (204) | (363) | (227) | (534) | (427) | |
| Min - Max | 5 - 131 | 12 - 131 | 10 - 91 | 5 - 110 | 11 - 62 | 9 - 80 | 12 - 58 | 7 - 106 | 6 - 77 | |
| Mean ± SD | 48.74 ± 22.55 | 52.41 ± 24.54 | 45.86 ± 23.11 | 32.86 ± 9.83 | 27.67 ± 16.56 | 44.88 ± 19.08 | 54.80 ± 23.05 | 41.12 ± 7.64 | ||
| 2nd conductivity test, mmol/L | (76) | (29) | (14) | (4) | (3) | (8) | (0) | (10) | (8) | |
| Min - max | 12 - 99 | 17 - 98 | 12 - 87 | 31 - 99 | 12 - 45 | 24 - 84 | 31 - 98 | 32 - 51 | ||
| Sensitivity (%) | Specificity (%) | Area Under Cure | ||
|---|---|---|---|---|
| 1st conductivity test | 53 mmol/L | 100 | 100 | 0.647 P > 0.05 |
| 58 mmol/L | 94 | 100 | ||
| 63 mmol/L | 88 | 100 | ||
| 2nd conductivity test | 60 mmol/L | 100 | 100 | 1 P < 0.007 |
| 61.5 mmol/L | 100 | 66 |
| 3 - 60 mmol/L | 61 - 80 mmol/L | > 80 mmol/L | CF Patients | ANOVA | |||
|---|---|---|---|---|---|---|---|
| Normal | Intermediate | Positive | |||||
| (n: 509) | (n: 9) | (n: 7) | (n: 17) | F | P | ||
| Na | Mean ± SD | 138.42 ± 3.75 | 137.72 ± 3.80 | 130.21 ± 5.64 | 133.43 ± 6.2 | 17.1 | < 0.001 |
| Median | 139 | 137.5 | 131 | 134 | |||
| Min - Max | 123 - 163 | 131 - 142 | 120 - 137 | 118 - 142 | |||
| K | Mean ± SD | 4.53 ± 0.71 | 4.45 ± 0.38 | 3.67 ± 0.56 | 4 ± 0.6 | 4.57 | 0.01 |
| Median | 4.5 | 4.5 | 3.5 | 4.15 | |||
| Min - Max | 2.3 - 7.3 | 3.9 - 5.2 | 3.1 - 4.5 | 3.1 - 4.7 | |||
| Cl | Mean ± SD | 103.29 ± 4.30 | 102.96 ± 4.52 | 88.43 ± 17.23 | 93.9 ± 15.5 | 35.85 | < 0.001 |
| Median | 104 | 103 | 88 | 101 | |||
| Min - Max | 80 - 138 | 94 - 109 | 64 - 106 | 64 - 108 | |||
| pH | Mean ± SD | 7.39 ± 0.7 | 7.39 ± 0.06 | 7.5 ± 0.12 | 7.47 ± 0.11 | 8.33 | < 0.001 |
| Median | 7.39 | 7.39 | 7.51 | 7.45 | |||
| Min - Max | 7.0 - 7.6 | 7.3 - 7.5 | 7.3 - 7.7 | 7.3 - 7.7 | |||
| pCO2 | Mean ± SD | 37.35 ± 8.31 | 36.31 ± 7.77 | 38.21 ± 8.68 | 37.96 ± 6.9 | 0.10 | 0.89 |
| Median | 36 | 38.5 | 40.4 | 40 | |||
| Min - Max | 20.6 - 102.1 | 23.9 - 46.2 | 21 - 48 | 23.9 - 48 | |||
| HCO3 | Mean ± SD | 22.17 ± 4.32 | 22 ± 3.86 | 30.64 ± 14.58 | 28.37 ± 12.8 | 11.98 | < 0.001 |
| Median | 21.6 | 22.3 | 25.5 | 25.5 | |||
| Min - Max | 9.6 - 43.4 | 15.6 - 27.6 | 17.6 - 54 | 15.6 - 54 | |||