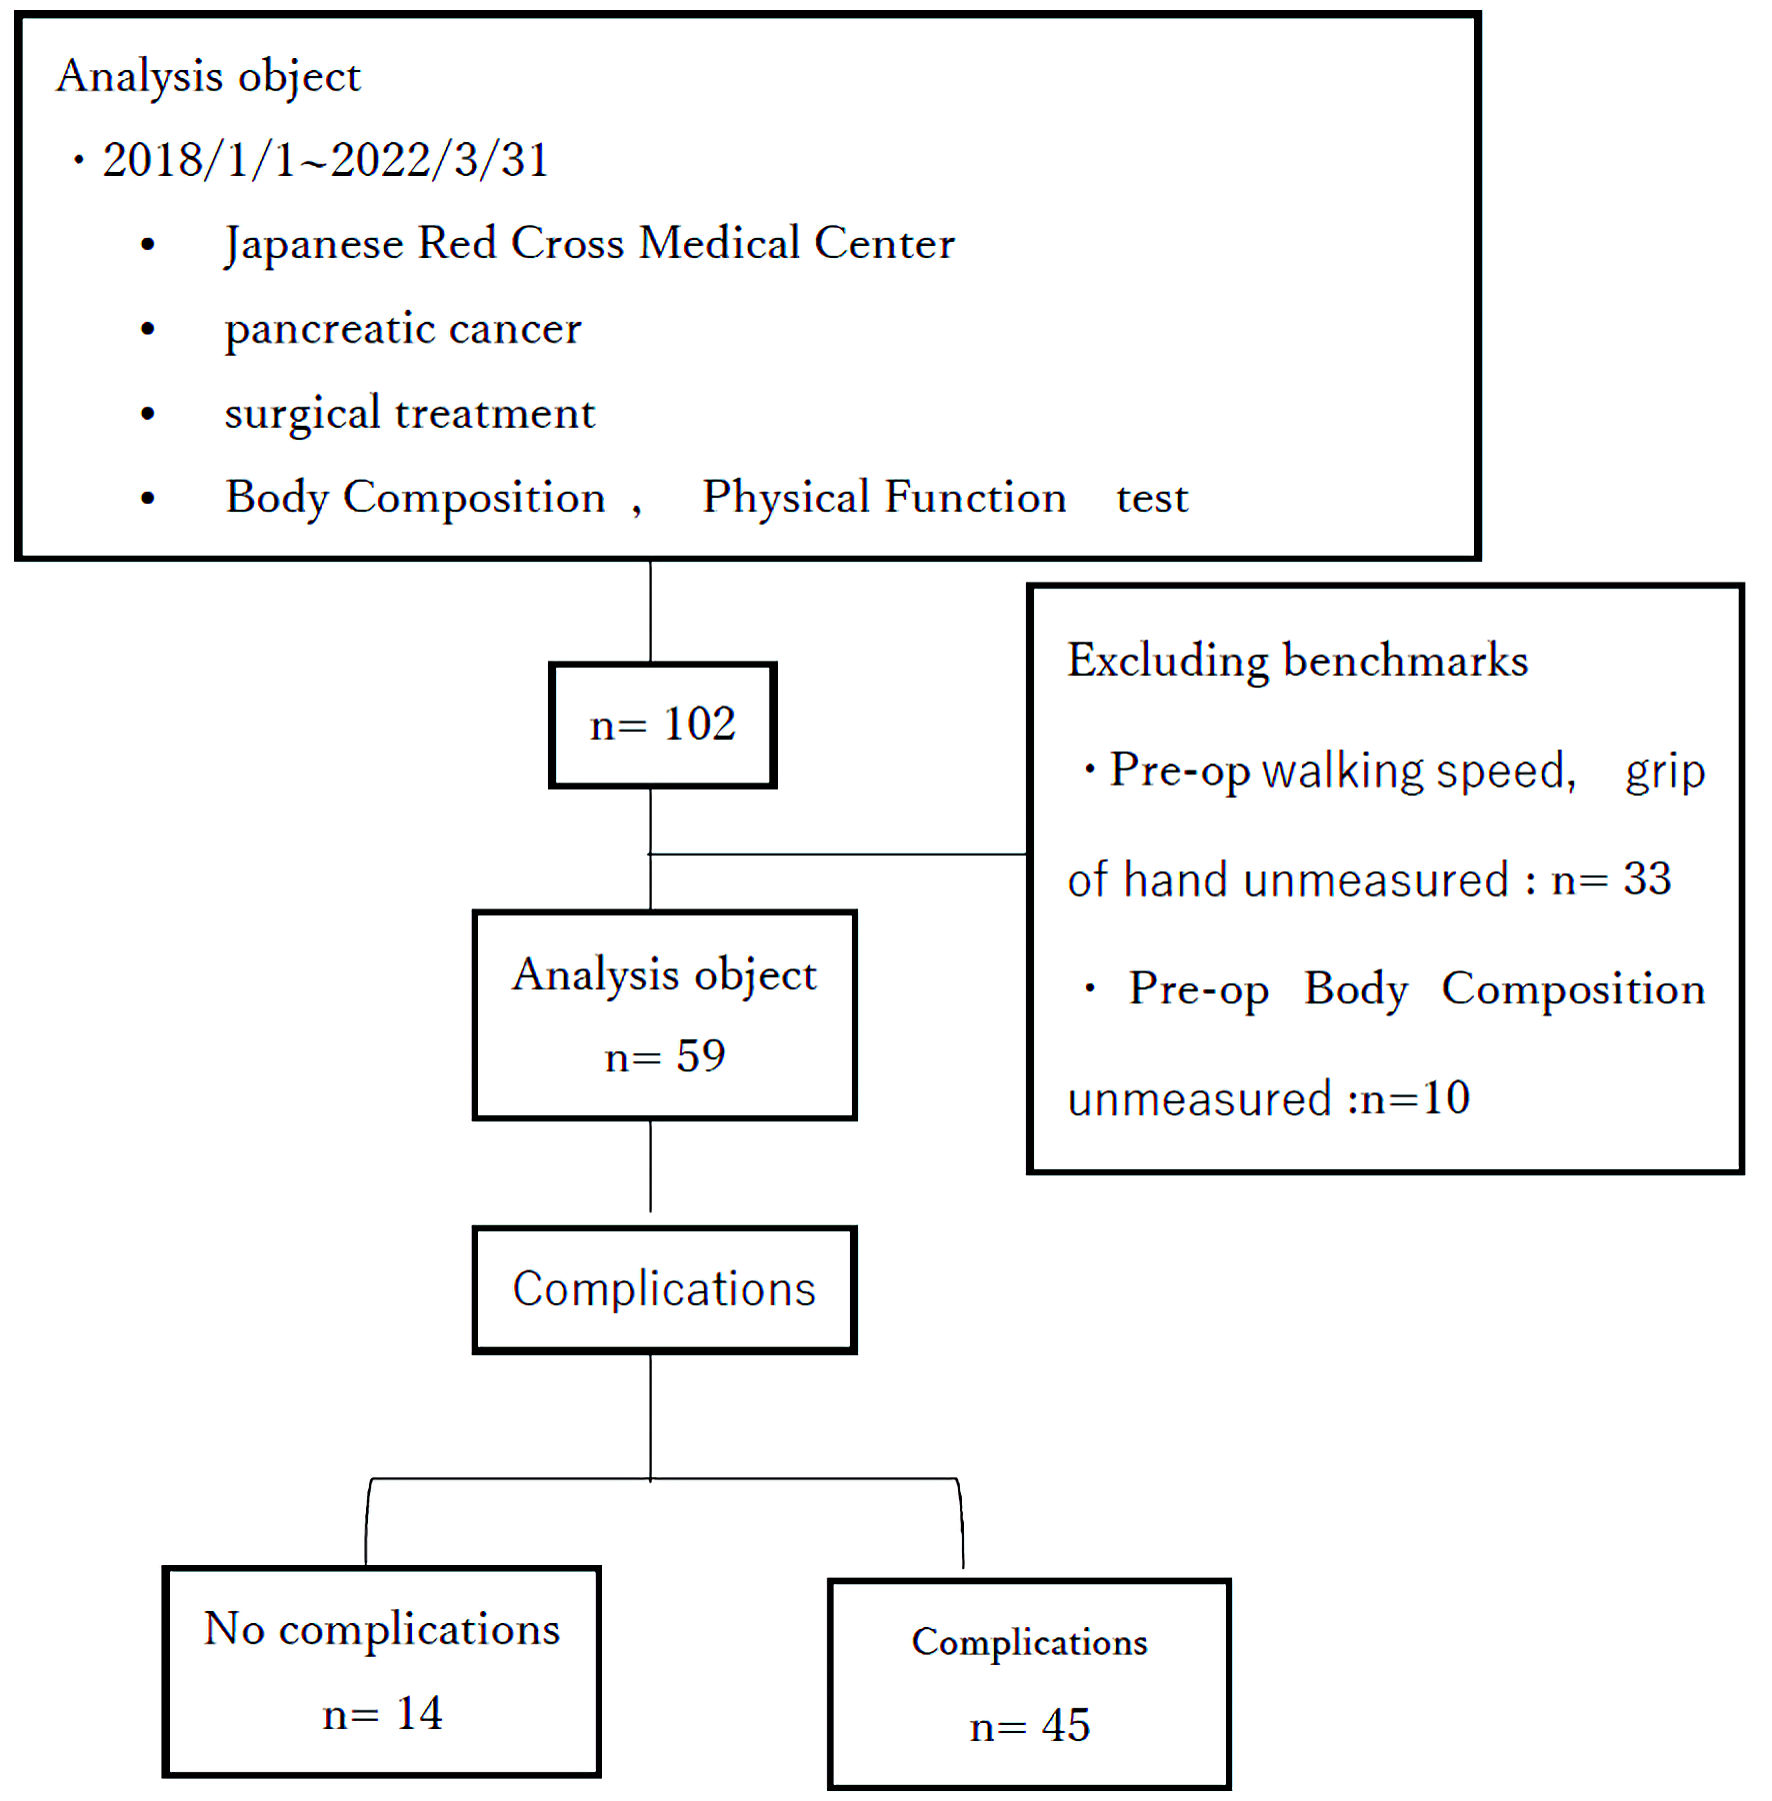
Figure 1. Flowchart of analysis study population. Pre-op: preoperative.
| Journal of Clinical Medicine Research, ISSN 1918-3003 print, 1918-3011 online, Open Access |
| Article copyright, the authors; Journal compilation copyright, J Clin Med Res and Elmer Press Inc |
| Journal website https://www.jocmr.org |
Original Article
Volume 15, Number 6, June 2023, pages 300-309
Preoperative Risk Factors in Patients With Pancreatic Cancer
Figures
Tables
| No complications (n = 14) | Complications (n = 45) | P value | |
|---|---|---|---|
| ASA-PS: American Society of Anesthesiologists - Physical Status; CONUT: controlling nutrition status; PNI: prognostic nutritional index; PD: pancreatoduodenectomy; DP: distal pancreatectomy; TP: total pancreatectomy. | |||
| ASA-PS (%) | |||
| 1 | 1 (7.1) | 2 (4.4) | 0.23 |
| 2 | 12 (85.7) | 30 (66.7) | |
| 3 | 1 (7.1) | 13 (28.9) | |
| Surgical technique | |||
| DP | 4 (28.6) | 25 (55.6) | 0.11 |
| PD | 10 (71.4) | 18 (40.0) | |
| TP | 0 (0.0) | 2 (4.4) | |
| Sex | |||
| Men | 5 (35.7) | 20 (44.4) | 0.75 |
| Women | 9 (64.3) | 25 (55.6) | |
| Age | 67.5 (54 - 78) | 74.0 (44 - 88) | 0.02 |
| Preoperative CONUT score | |||
| ≤ 4 | 14 (100.0) | 39 (86.7) | 0.31 |
| ≥ 5 | 0 (0.0) | 6 (13.3) | |
| Preoperative PNI | |||
| < 40 | 0 (0.0) | 4 (8.9) | 0.56 |
| > 40 | 14 (100.0) | 41 (91.1) | |
| Anesthesia time (h) | 10.45 (6.7 - 14.8) | 8.6 (3.5 - 14.9) | 0.47 |
| Operation time (h) | 9.2 (5.5 - 13.6) | 7.6 (2.5 - 13.6) | 0.58 |
| Infusion volume (mL) | 2,725 (1,550 - 5,950) | 2,500 (850 - 2,950) | 0.72 |
| Blood transfusion | |||
| No | 6 (42.9) | 28 (62.2) | 0.22 |
| Yes | 8 (57.1) | 17 (37.8) | |
| Urine output (mL) | 385 (50 - 1,280) | 302 (80 - 1,155) | 0.29 |
| Blood loss (mL) | 547.5 (210 - 1,820) | 550.0 (70 - 2,120) | 0.50 |
| First oral intake (day) | 3 (1 - 3) | 2 (1 - 17) | 0.25 |
| First time leaving the bed (day) | 1 (1 - 3) | 1 (1 - 6) | 0.63 |
| Hospital after day | 30.5 (19 - 40) | 33 (18 - 74) | 0.07 |
| No complications (n = 14) | Complications (n = 45) | P value | |
|---|---|---|---|
| ALB: albumin; TP: total protein; T-cho: total cholesterol; TLC: total lymphocyte count; CRP: C-reactive protein. | |||
| ALB (g/dL) | 4.1 (3.3 - 4.8) | 4.0 (2.3 - 4.2) | 0.24 |
| TP (g/dL) | 6.8 (5.1 - 7.7) | 6.8 (5.1 - 7.9) | 0.44 |
| T-cho (mg/dL) | 195(116 - 141) | 187 (120 - 270) | 0.41 |
| TLC (µL) | 1,260 (274 - 2,290) | 1,340 (114 - 2,883) | 0.17 |
| CRP (mg/dL) | 0.05 (0.02 - 0.28) | 0.11 (0.01 - 6.01) | 0.16 |
| Transferrin (mg/dL) | 235.5(193 - 271) | 241.0 (152 - 350) | 0.82 |
| Prealbumin (mg/dL) | 24.1 (15.5 - 30.7) | 24.1 (9.7 - 36.4) | 0.70 |
| Preoperative | Postoperative | |||||
|---|---|---|---|---|---|---|
| No complications (n = 14) | Complications (n = 45) | P value | No complications (n = 14) | Complications (n = 45) | P value | |
| CONUT: controlling nutrition status; PNI: prognostic nutritional index. | ||||||
| Sarcopenia | ||||||
| No | 14 (100.0) | 42 (93.3) | 0.99 | 13 (100.0) | 35 (87.5) | 0.31 |
| Yes | 0 (0.0) | 3 (6.7) | 0 (0.0) | 5 (12.5) | ||
| Walking speed (m/s) | 1.45 (0.76 - 2.1) | 0.93 (0.3 - 2.2) | 0.01 | 1.03 (0.78 - 2.5) | 0.98 (0.32 - 2.0) | 0.37 |
| Grip of hand (kg) | 27.5 (16.0 - 47.5) | 26.5 (9.5 - 54.0) | 0.36 | 28.5 (13.6 - 47.5) | 24.6 (13.0 - 57.0) | 0.25 |
| CONUT score (point) | 2 (1 - 3) | 2 (0 - 10) | 0.51 | 3 (2 - 9) | 4 (1 - 7) | 0.26 |
| PNI score | 47.59 (3.50) | 46.87 (5.56) | 0.648 | |||
| Survival | ||||||
| Mortality | 2 (14.3) | 13 (28.9) | 0.606 | |||
| Existence | 11 (78.6) | 29 (64.4) | ||||
| Hospital after day | 30.5 (19 - 40) | 33 (18 - 74) | 0.07 | |||
| Preoperative | Postoperative | |||||
|---|---|---|---|---|---|---|
| No complications (n = 14) | Complications (n = 45) | P value | No complications (n = 14) | Complications (n = 45) | P value | |
| BMI: body mass index. | ||||||
| Fat mass (kg) | 10.75 (2.4 - 23.2) | 16.50 (4.7 - 46.2) | 0.02 | 8.6 (3.1 - 22.7) | 14.2 (5.8 - 35.6) | 0.09 |
| BMI (kg/m2) | 19.15 (15.8 - 27.1) | 22.40 (16.8 - 35.2) | 0.1 | 17.7 (14.8 - 26) | 21.15 (15.6 - 34) | 0.06 |
| Muscle mass (kg) | 36.3 (30.5 - 53.7) | 35.7 (28.3 - 59.3) | 0.92 | 33.3 (28.8 - 52.1) | 35.8 (28.2 - 62.9) | 0.25 |
| Grip of hand (kg) | 27.5 (16.0 - 47.5) | 26.5 (9.5 - 54.0) | 0.36 | 28.5 (13.6 - 47.5) | 24.6 (13.0 - 57.0) | 0.25 |
| Comparison of before and after surgery | |||
|---|---|---|---|
| No complications (n = 14) | Complications (n = 45) | P value | |
| BMI: body mass index. | |||
| Fat mass (kg) | 0 (-0.2 - 1.1) | -0.14 (-0.8 - 0.1) | 0.02 |
| BMI (kg/m2) | -0.06 (-0.09 - 0) | -0.05(-0.1 - 0.02) | 0.9 |
| Muscle mass (kg) | -0.05 (-0.17 - 0.01) | -0.04 (-0.17 - 0.09) | 0.44 |
| Grip strength of hand (kg) | -0.04 (-0.2 - 0.6) | -0.04 (-0.39 - 0.3) | 0.56 |
| Univariate analysis | Multivariable logistic regression | |||||
|---|---|---|---|---|---|---|
| Odds ratio | 95% CI | P value | Odds ratio | 95% CI | P value | |
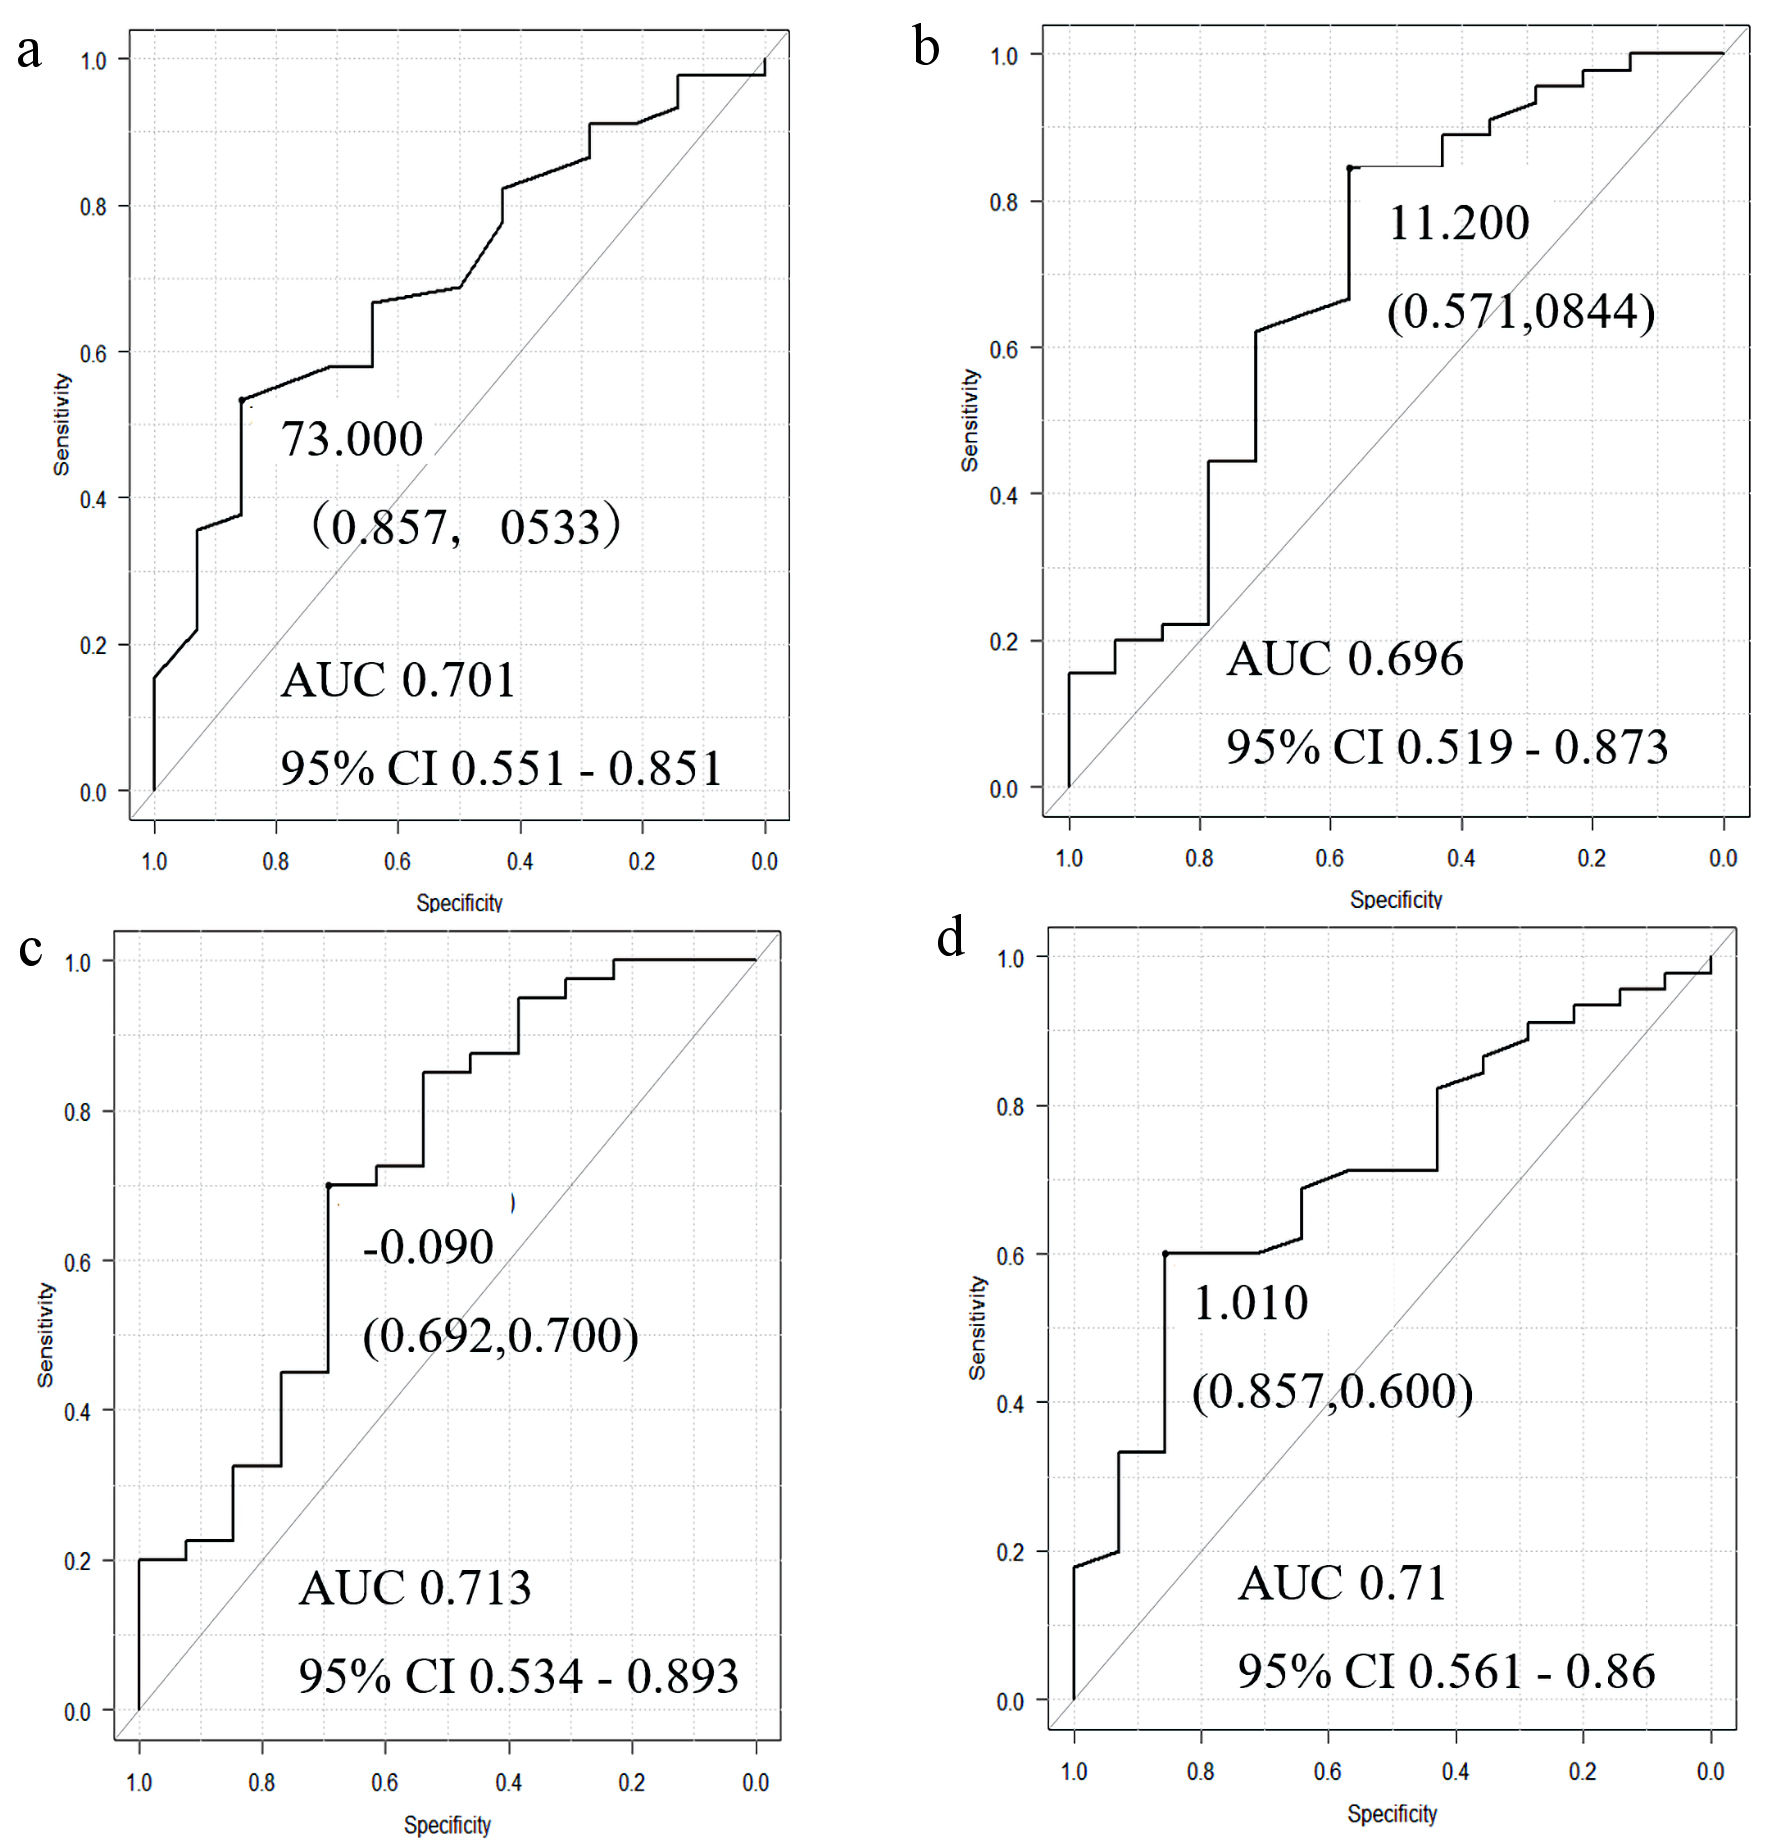
| Cut-off values were calculated from ROC curves for the four items of fat mass, age, walking speed, and fat mass change that differed significantly; and continuous variables were made binary. Logistic regression analysis was used to examine risk factors. CI: confidence interval. | ||||||
| Age | 6.86 | 1.370 - 34.2 | 0.01 | 27.6 | 1.34 - 569.0 | 0.03 |
| Walking speed | 0.122 | 0.0244 - 0.609 | 0.01 | 0.119 | 0.0134 - 1.07 | 0.05 |
| Fat mass | 7.24 | 1.910 - 27.4 | 0.01 | 15.900 | 1.4900 - 168.0 | 0.02 |
| Fat mass change rate | 6.61 | 1.640 - 26.6 | 0.01 | 5.730 | 0.7590 - 43.2 | 0.09 |