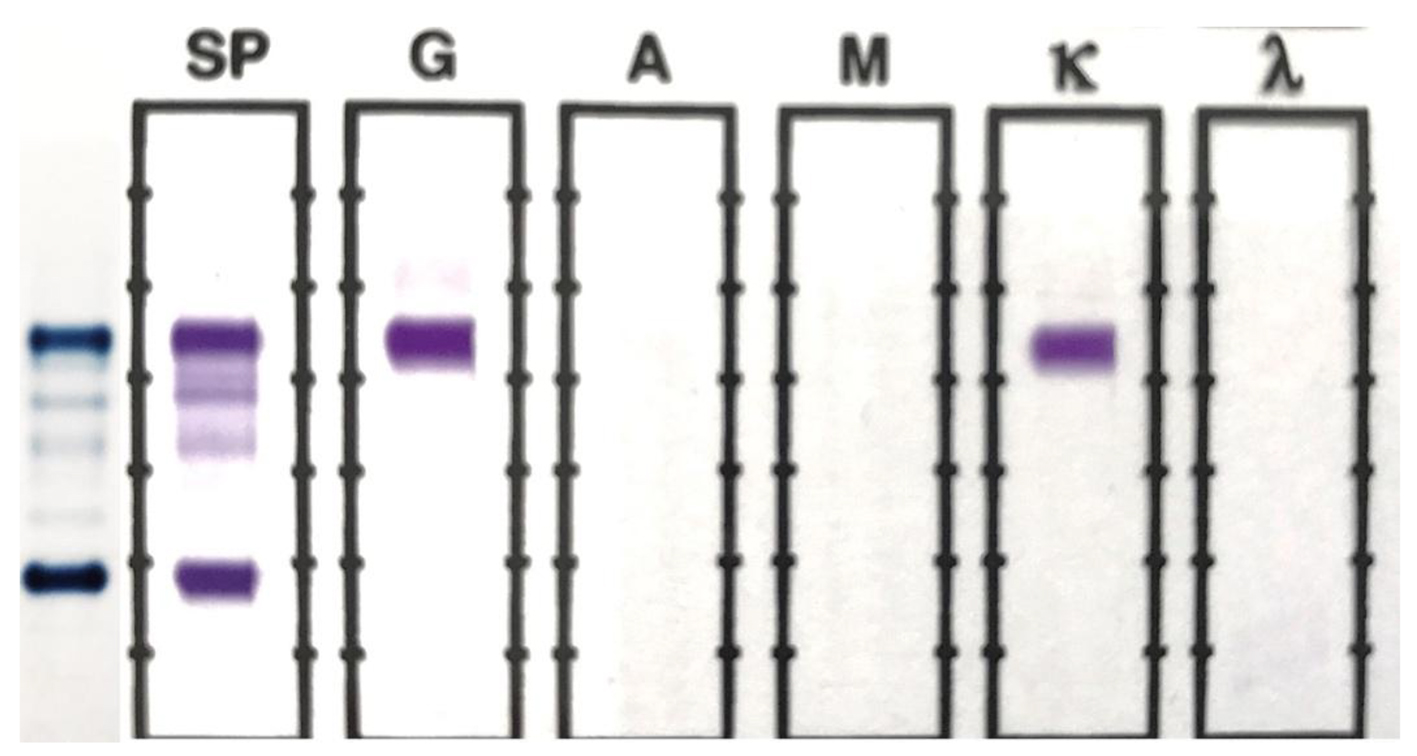
Figure 1. SPEP and SIFE in November 2016. A prominent monoclonal band is present at the beta-gamma interface on SPEP, which typed as IgG kappa on SIFE. The background immunoglobulins are markedly suppressed.
| Journal of Clinical Medicine Research, ISSN 1918-3003 print, 1918-3011 online, Open Access |
| Article copyright, the authors; Journal compilation copyright, J Clin Med Res and Elmer Press Inc |
| Journal website http://www.jocmr.org |
Original Article
Volume 9, Number 10, October 2017, pages 826-830
Prospective Identification of Oligoclonal/Abnormal Band of the Same Immunoglobulin Type as the Malignant Clone by Differential Location of M-Spike and Oligoclonal Band
Figures
Table
| Date | Malignant spike | Oligoclonal band | Second oligoclonal band | Immunoglobulin level mg/dL | UPEP/UIFE | Serum free light chain assay results | ||||
|---|---|---|---|---|---|---|---|---|---|---|
| IgA | IgG | IgM | Kappa | Lambda | K/L ratio | |||||
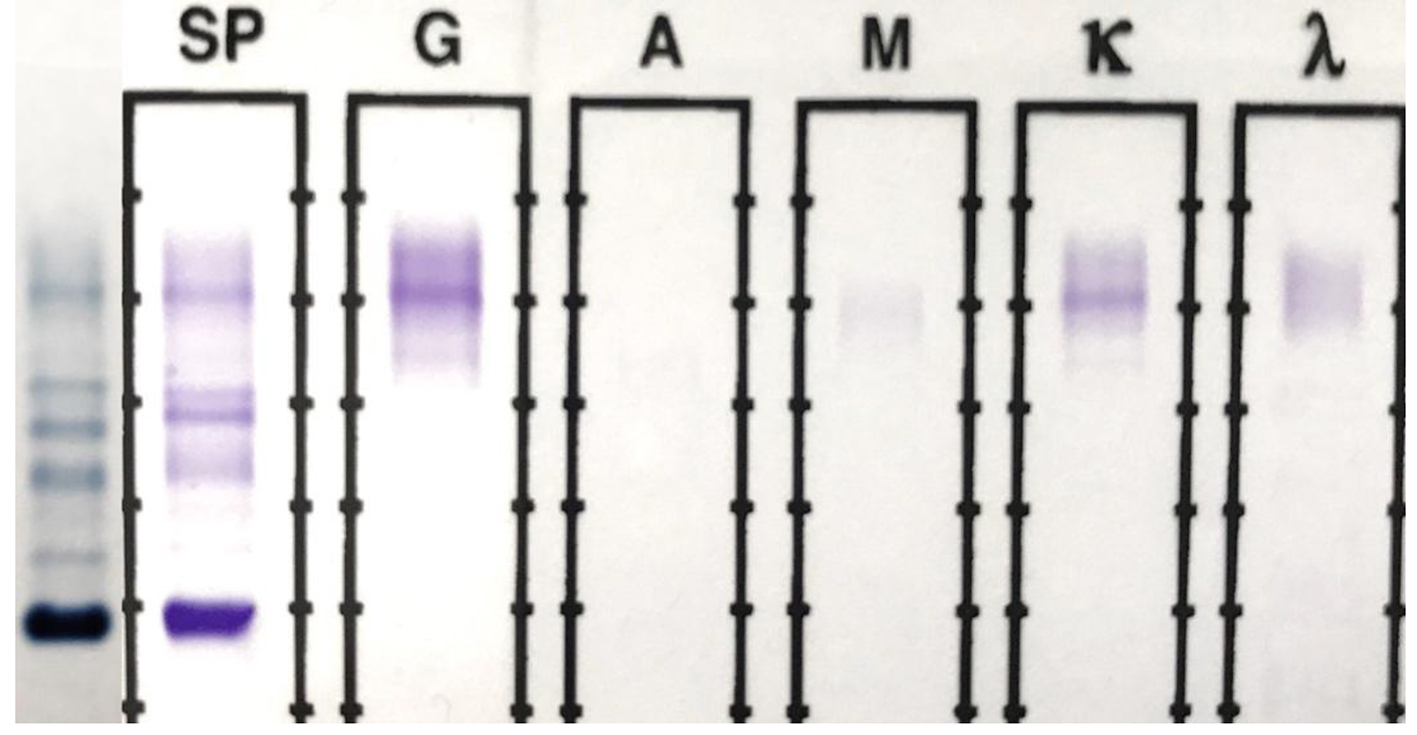
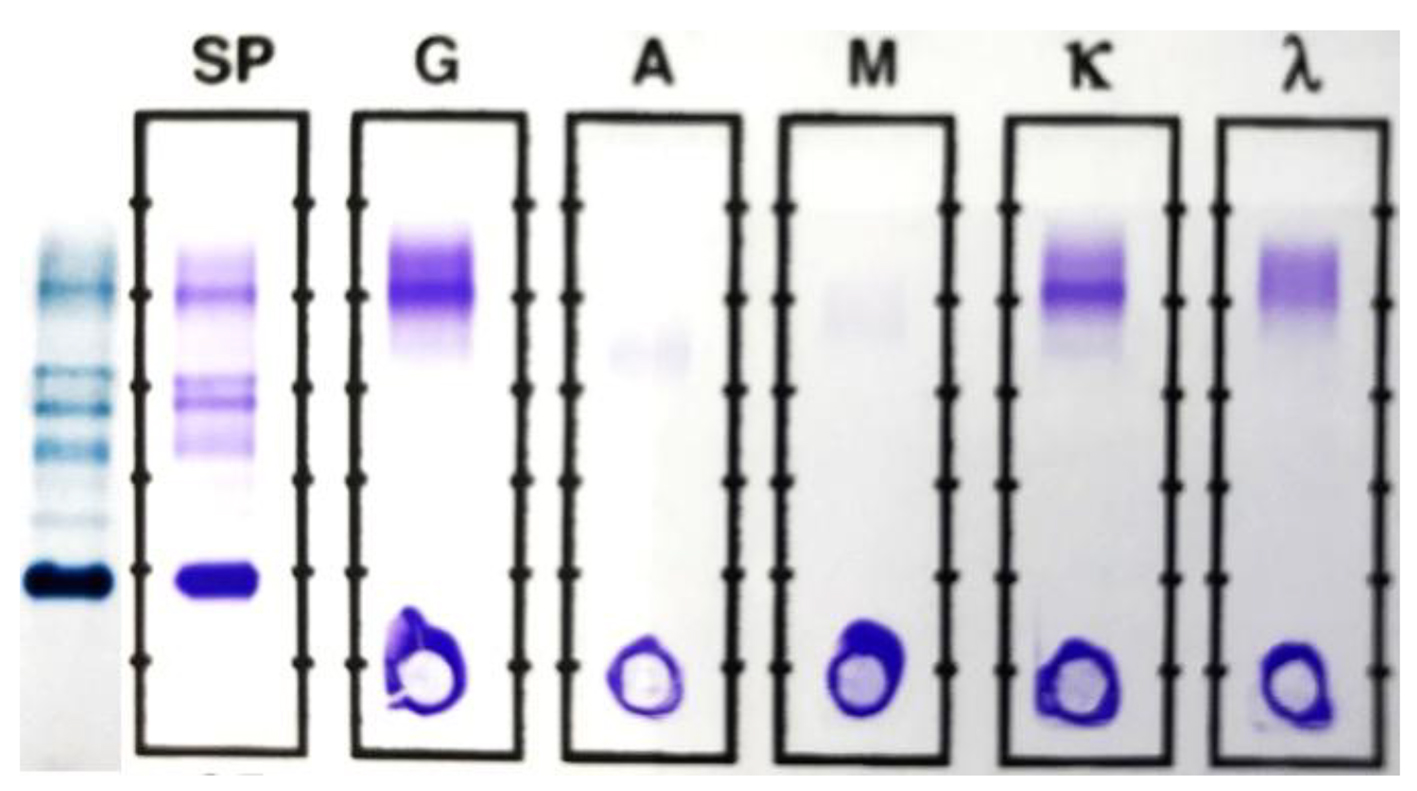
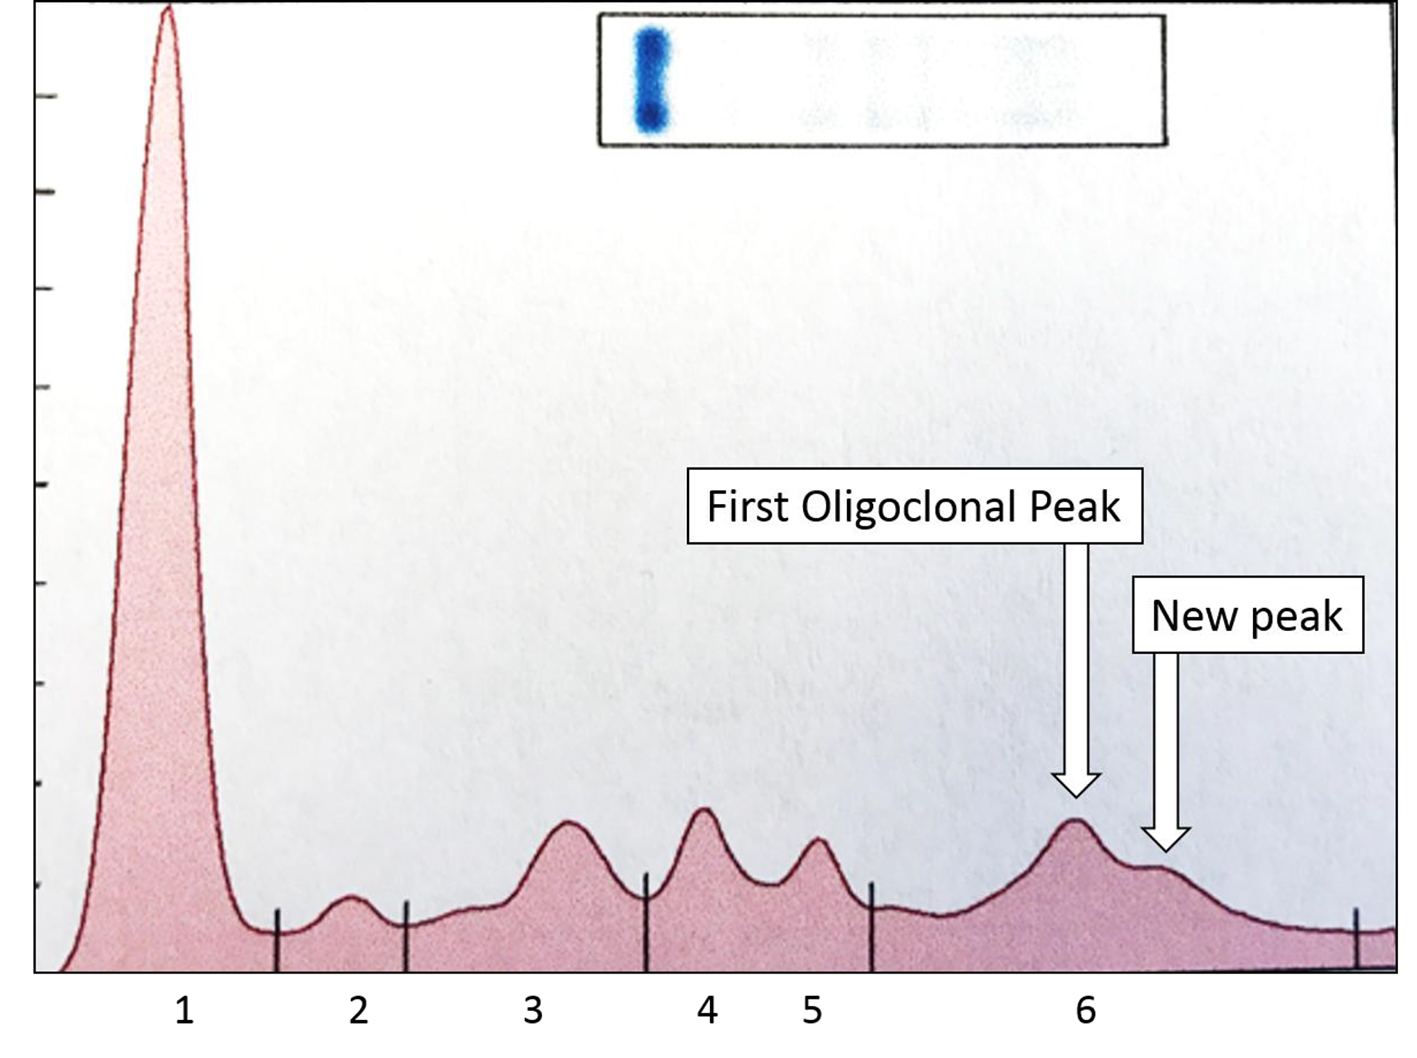
| The initial malignant clone disappeared, while an oligoclonal pattern developed, in the following two SPEPs. A second oligoclonal band is also noted on the third SPEP. The κ/λ ratio is kappa dominant in the first two samples, but is in the normal range in the June 2017 sample. | ||||||||||
| November 2016 | 2.19 g/dL | 0 | 0 | 25 | 2,631 | 17 | IgG kappa | 9.25 | 0.71 | 13.03 |
| March 2017 | 0 | 0.25 g/dL | 0 | 29 | 994 | 65 | IgG kappa | 4.84 | 2.19 | 2.21 |
| June 2017 | 0 | 0.38 g/dL | 0.12 g/dL | 51 | 1,124 | 46 | NA | 4.7 | 3.01 | 1.56 |