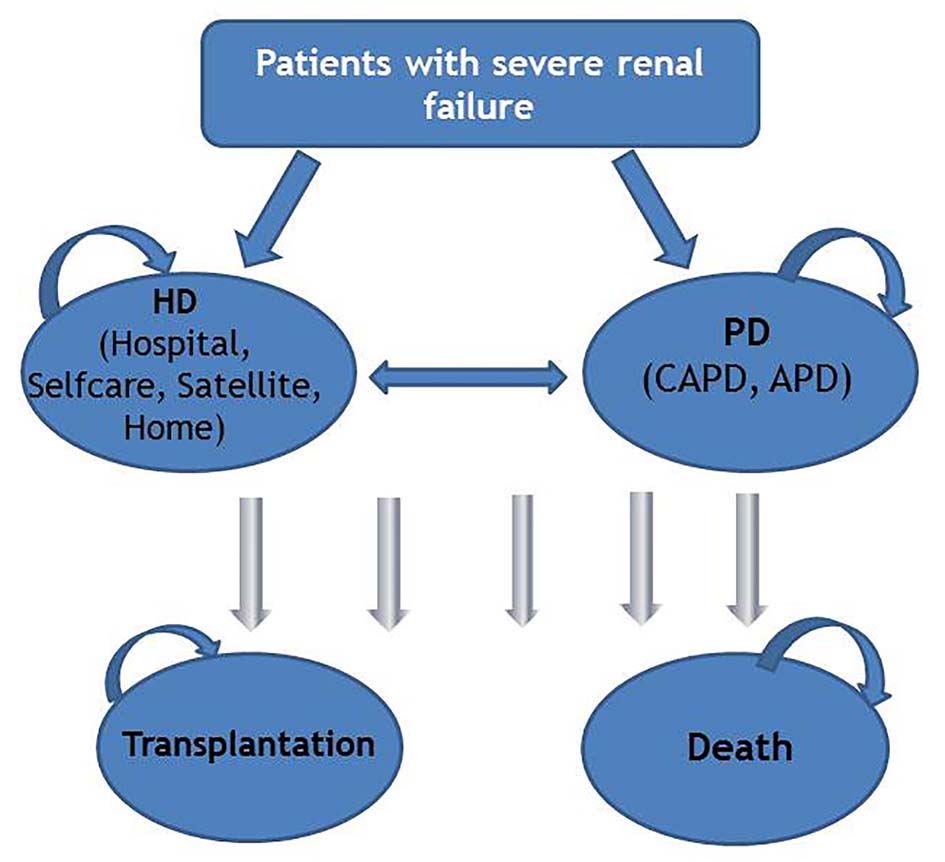
Figure 1. Model structure. HD: hemodialysis; PD: peritoneal dialysis; CAPD: continuous ambulatory peritoneal dialysis; APD: automated peritoneal dialysis.
| Journal of Clinical Medicine Research, ISSN 1918-3003 print, 1918-3011 online, Open Access |
| Article copyright, the authors; Journal compilation copyright, J Clin Med Res and Elmer Press Inc |
| Journal website http://www.jocmr.org |
Original Article
Volume 9, Number 2, February 2017, pages 104-116
More Use of Peritoneal Dialysis Gives Significant Savings: A Systematic Review and Health Economic Decision Model
Figures
Tables
| Definition | Value (SE) | Source/note | |||||
|---|---|---|---|---|---|---|---|
| SE: standard error; QALY: quality-adjusted life year; HD: hemodialysis; PD: peritoneal dialysis. aIncluding costs associated with additional training for nurses in the satellite unit, EUR1,610 per patient per year. bInitial cost. cIncluding costs associated with line rental for broadband and telemedicine equipment. dHD home patients were treated at the hospital in the training period (about 6 weeks) which infrastructure costs were estimated to be EUR1,143 (initial cost). eTravel cost associated with complications and initial of treatment were presented in Supplementary 8 (www.jocmr.org). fIt was assumed that PD patients and HD home patients visit the hospital 12 - 15 times per year. gValue of loss time because of travel during training period (6 weeks) was calculated to be EUR5,917 (initial cost). hWe assumed that 30-50% of patients were accompanied by another person when visiting the medical center. iWe assumed that 10-30% of patients were accompanied by another person when visiting the medical center. | |||||||
| Probabilities (range of 5 years) | PD to HD | 0.05 - 0.14 | Norwegian Renal Registry [11] | ||||
| HD to PD | 0.01 - 0.03 | ||||||
| Dialysis to transplant | 0.07 - 0.13 | ||||||
| Dialysis to death | 0.10 - 0.23 | ||||||
| Efficacy estimate | All-cause mortality: PD vs. HD hospital; HD home vs. HD satellite | 1.11 (0.33) 0.60 (0.31) | Based on the results of our systematic review (Supplementary 4, www.jocmr.org) | ||||
| QALY weight | Patients on dialysis | 0.54 (0.105) | Sennfalt et al, 2005 [19] | ||||
| Infection | -0.19 (0.010) | Sennfalt et al, 2005 [19] | |||||
| Acute myocardial infarction | -0.27 (0.03) | Lund and Wisloff, 2012 [20] | |||||
| Angina | -0.22 (0.03) | Lund and Wisloff, 2012 [20] | |||||
| Sepsis | -0.28 (0.12) | Korosec et al, 2006 [21] | |||||
| Costs per patient per year in EUR (EUR 1.00 ≈ NOK 7.47) | HD hospital | HD self-care | HD satellite | HD home | PD | ||
| Personnel costs | 31,914 | 23,871 | 31,940a | 3,502 | 5,417 | Based on the average healthcare staff salary per month from Statistics Norway (Supplementary 5, www.jocmr.org) | |
| Dialysis supplies | 85,800 | 85,800 | 85,800 | 408,320 | 273,570 | PD: based on actual price in Norway in 2012 HD: based on data from three major hospitals in Norway Home HD: based on the price list provided by Oslo University Hospital | |
| Dialysis supplies-trainingb | 825 | 10,140 | 5,600 | Assumption | |||
| Medication | 105,685 | 84,235 | 105,685 | 96,420 | 26,282 | Based on data reported by the Norwegian renal registry, Norwegian Medicines Agency (Supplementary 6, www.jocmr.org) | |
| Laboratory test | 18,124 | 18,124 | 18,124 | 18,124 | 15,855 | Based on data provided by Oslo University Hospital | |
| Complications | 24,330 | 23,590 | 20,840 | 18,885 | 30,570 | Norwegian Medicine Agency Wisloff et al, 2012 [13, 14] | |
| Capital costs | 44,840 | 44,840 | 44,840 | 5,000 | 6,210 | Nyhus et al, 2007 [12], Oslo University Hospital | |
| Infrastructure costs | 74,030 | 74,030 | 102,640 | 6,565d | 6,565 | Nyhus et al, 2007 [12] | |
| Telemedicinec | 27,600 | Bjorvatn, 2004 [15], assumption | |||||
| Home care | 27,405 | 89,425 | [16, 17] | ||||
| Transport costse | 227,310 | 227,310 | 165,700 | 160,000f | 110,000f | Based on data obtained from dialysis centres across the country | |
| Staff travel | 10,800 | Bjorvatn, 2004 [15] | |||||
| Value of leisure time; patient | 287,330 | 287,330 | 287,330 | 27,630f, g | 27,630 f | Assumption [18] | |
| Value of leisure time; companion | 114,930h | 57,470i | 114,930h | 5,530i | 11,050 h | Assumption [18] | |
| Total costs (EUR) | Effects (QALYs) | Versus PD | Sequential ICER (EUR/QALY) | |||
|---|---|---|---|---|---|---|
| Incremental cost (EUR) | Incremental effect (QALYs) | ICER (EUR/QALY) | ||||
| All HD strategies were compared to PD, because none of the more effective strategies were cost-effective compared to PD. QALY: quality-adjusted life year; ICER: incremental cost-effectiveness ratio; INHB: incremental net health benefit; HD: hemodialysis; PD: peritoneal dialysis. | ||||||
| PD | 164,741 | 1.6825 | ||||
| HD home | 228,362 | 1.8613 | 63,621 | 0.1788 | 355,822 | 355,822 |
| Dominated strategies | ||||||
| HD hospital | 317,501 | 1.7169 | 152,760 | 0.0344 | 4,440,698 | Dominated by HD home |
| HD self-care | 261,260 | 1.7170 | 96,519 | 0.0344 | 2,805785 | Dominated by HD home |
| HD satellite | 352,048 | 1.7181 | 187,308 | 0.0356 | 5,261,461 | Dominated by HD home |
| Number of patients | Cost (in millions, EUR) | Cost-saving (in millions, EUR) | ||||||
|---|---|---|---|---|---|---|---|---|
| HD | PD | Total | HD | PD | Total | |||
| HD: hemodialysis; PD: peritoneal dialysis; EU: The European Union. aIn Norway PD in 2012 was actual 15.8%. bIn-center HD includes HD in hospital and satellites. | ||||||||
| Norway | 2017 (annual growth rate of 4%) PD: 15%a In-center HD: 85%b | 1,284 | 227 | 1,510 | 398 | 37 | 435 | |
| Scenario PD: 30% In-center HD: 70% | 1,057 | 453 | 1,510 | 328 | 75 | 403 | 32 | |
| EU | 2017 (annual growth rate of 4%) PD: 10% In-center HD: 90% | 328,500 | 36,500 | 365,000 | 101,923 | 6,013 | 107,936 | |
| Scenario 1 PD: 20% In-center HD: 80% | 292,000 | 73,000 | 365,000 | 90,599 | 12,026 | 102,625 | 5,311 | |
| Scenario 2 PD: 30% In-center HD: 70% | 255,500 | 109,500 | 365,000 | 79,274 | 18,039 | 97,313 | 10,623 | |