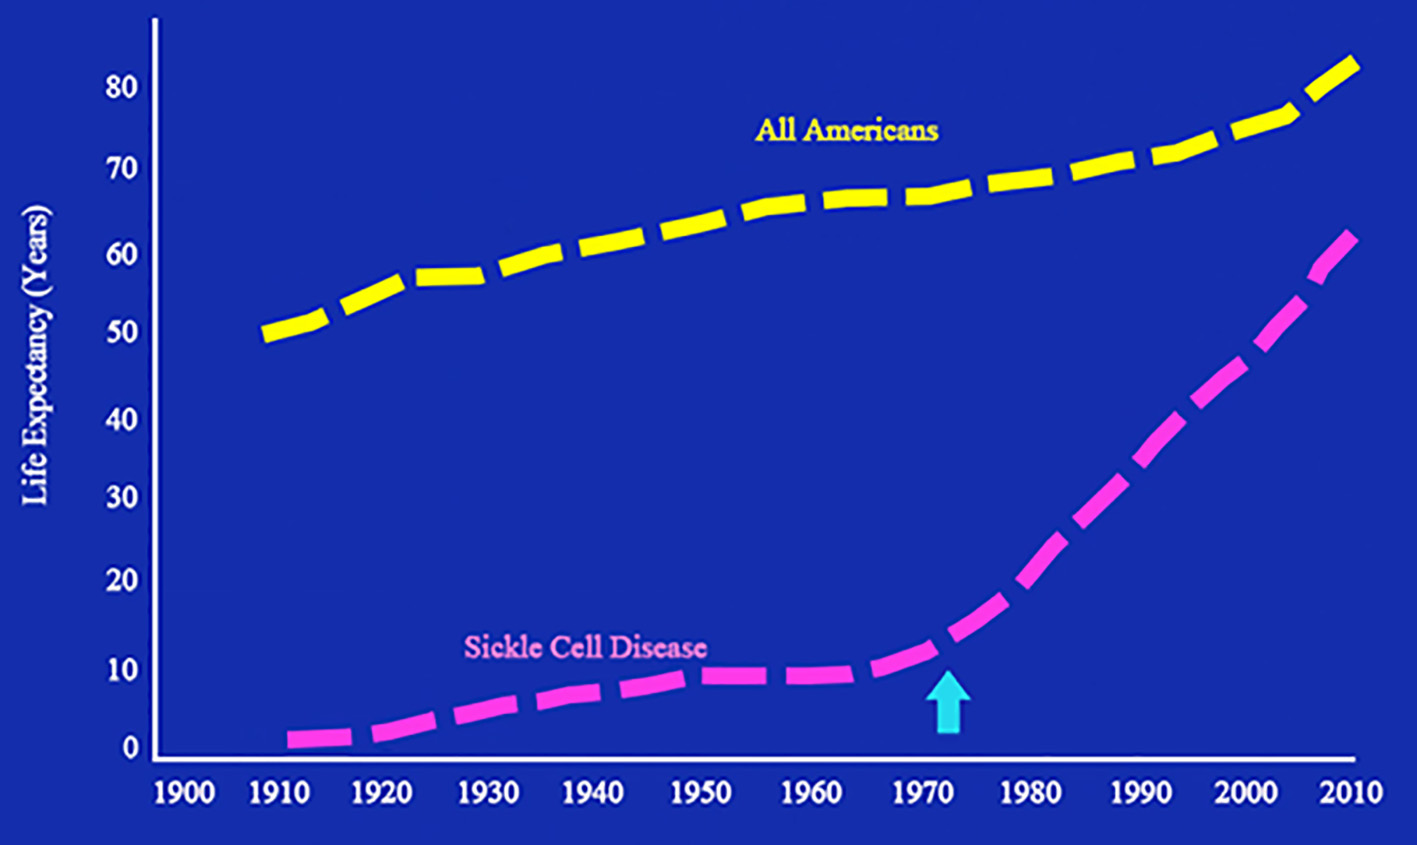
Figure 1. Life expectancy of patients with sickle cell disease from 1900 through 2010. The arrow indicates the infliction point where life expectancy of patients with sickle cell disease began to increase. Adapted from National Heart, Lung, and Blood Institute. Sickle cell research for treatment and cure (NIH Publication No. 02-5214). Bethesda, MD: US Department of Health and Human Services.

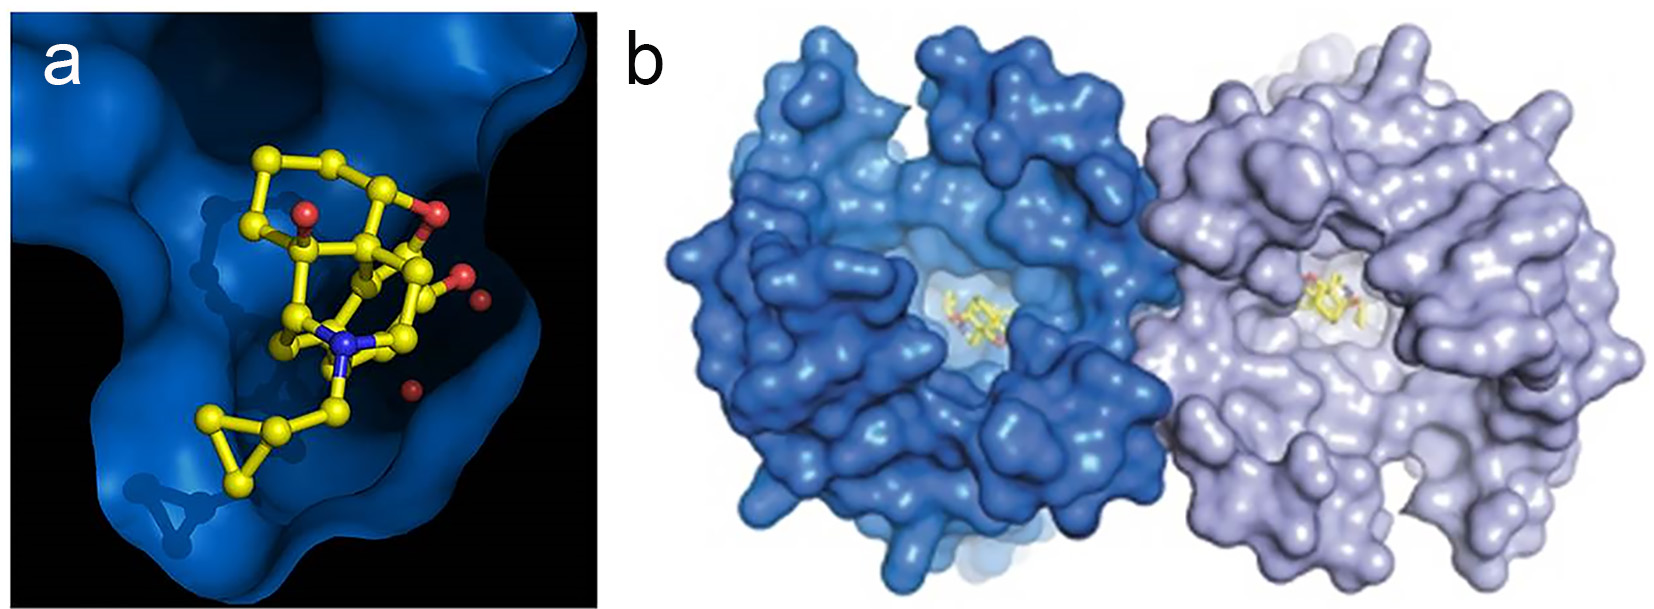
Figure 2. Helical structure of opioid receptors. (a) Morphine-like molecule (yellow) in the deep pocket (blue) of the μ-opioid receptor. (b) μ-Opioid receptors from an intimate pair when crystallized with a ligand (yellow) such as morphine. Knowing how an opioid molecule (yellow) sticks in the pocket of its receptor (blue) could help scientists design better analgesics that are more effective and less addictive. Credit: Kobilka Lab, Nature. 2012;485:321-6. Used with permission.

