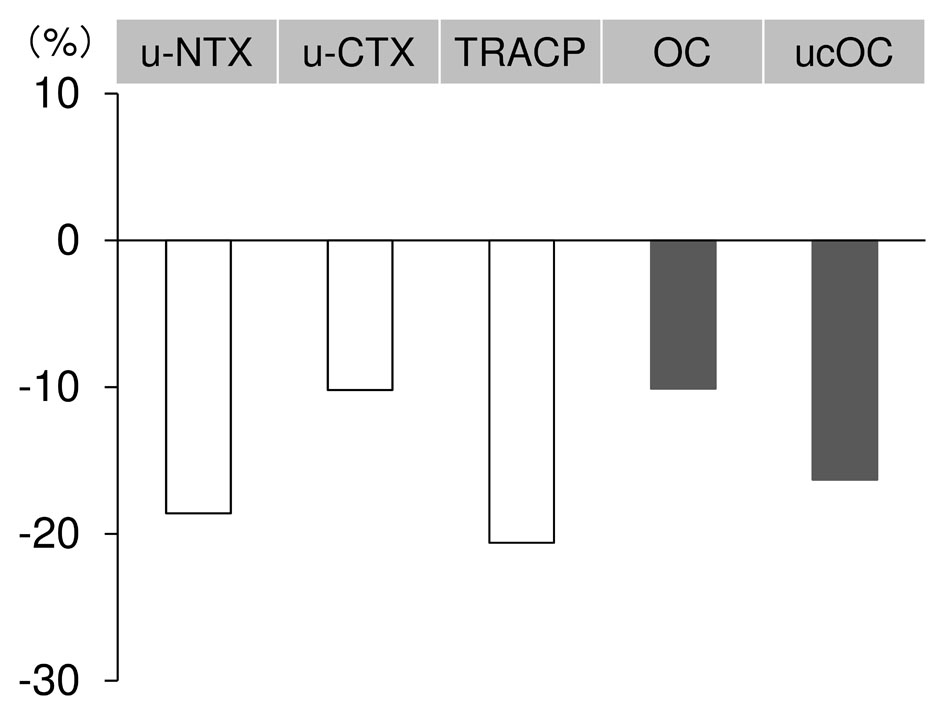
| Journal of Clinical Medicine Research, ISSN 1918-3003 print, 1918-3011 online, Open Access |
| Article copyright, the authors; Journal compilation copyright, J Clin Med Res and Elmer Press Inc |
| Journal website http://www.jocmr.org |
Original Article
Volume 7, Number 10, October 2015, pages 762-769
The Effects of Bazedoxifene on Bone, Glucose, and Lipid Metabolism in Postmenopausal Women With Type 2 Diabetes: An Exploratory Pilot Study
Figure

Tables
| Baseline (n = 20) | |
|---|---|
| Data are reported as means ± standard deviation or medians (min - max). BMI: body mass index; YAM: young adult mean; FRAX® tool: Fracture Risk Assessment Tool; ARBs: angiotensin II receptor blocker. | |
| Age (years) | 67.9 ± 5.5 |
| Menopause age (years) | 50.2 ± 5.1 |
| Diabetes duration (years) | 4.5 (1 - 24) |
| Height (cm) | 153.5 ± 4.4 |
| BMI (kg/m2) | 22.5 ± 2.8 |
| HbA1c (%) | 6.3 (5.4 - 7.4) |
| Serum creatinine (mg/dL) | 0.61 (0.39 - 0.82) |
| Microangiopathy | |
| Neuropathy (%) | 29 (5/17) |
| Retinopathy (%) | 0 (0/17) |
| Nephropathy (%) | |
| Stage 1 | 82 (14/17) |
| Stage 2 | 18 (3/17) |
| Macroangiopathy | |
| Coronary artery disease (%) | 5.9 (1/17) |
| Cerebrovascular disease (%) | 24 (4/17) |
| Peripheral artery disease (%) | 0 (0/17) |
| Smoking (%) | |
| Former smoker | 20 (5/20) |
| Current smoker | 0 (0/20) |
| Alcohol (%) | 0 (0/20) |
| Lumbar | |
| Bone mineral density (g/cm2) | 0.9 ± 0.2 |
| T-score | -1.3 ± 1.6 |
| YAM (%) | 86.4 ± 17.0 |
| Femoral neck | |
| Bone mineral density (g/cm2) | 0.6 ± 0.1 |
| T-score | -1.6 ± 0.8 |
| YAM (%) | 78.2 ± 10.9 |
| FRAX® tool | |
| Major osteoporotic (years) | 8.3 (5.2 - 24) |
| Hip fracture (years) | 1.3 (0.4 - 7.6) |
| History of the vertebral fracture | 0 (0/20) |
| History of the non-vertebral fracture | 0 (0/20) |
| Family history of the femoral neck fracture | 0 (0/20) |
| Medications | |
| Anti-diabetes | |
| Diet only (%) | 15 (3/20) |
| Sulfonylureas (%) | 20 (4/20) |
| Glinides (%) | 10 (2/20) |
| Biguanides (%) | 25 (5/20) |
| DPP-IV inhibitors (%) | 45 (9/20) |
| GLP-1 analogues (%) | 10 (2/20) |
| α-glucosidase inhibitors (%) | 5 (1/20) |
| Insulin (%) | 5 (1/20) |
| Anti-dyslipidemia | |
| Stains (%) | 35 (7/20) |
| Ezetimibe (%) | 15 (3/20) |
| Anti-hypertension | |
| ARBs (%) | 30 (6/20) |
| 0 weeks | 4 weeks | 12 weeks | P value vs. 4 weeks | P value vs. 12 weeks | |
|---|---|---|---|---|---|
| *Data are reported as medians (min - max). **Patients with insulin therapy (n = 1) were excluded from analysis of HOMA-IR and HOMA-β. UACR: urinary albumin-to-creatinine ratio; NS: no significance. | |||||
| uNTX (nmol BCE/mmol CRE) | 36.9 (16.4 - 126) | 28.3 (15.2 - 66.9) | 29.7 (20.5 - 74.4) | 0.008 | NS |
| uCTX (μg/mmol CRE) | 232 (57 - 666) | 180 (57-390) | 181 (70-414) | 0.011 | NS |
| TRACP-5b (mU/dL) | 325 (155 - 606) | 257 (149 - 472) | 259 (141 - 388) | < 0.001 | < 0.001 |
| Osteocalcin (ng/mL) | 7.7 (4.6 - 13) | 7.8 (5.3 - 12) | 7.1 (5.3 - 10) | NS | NS |
| Undercarboxylated osteocalcin (ng/mL) | 3.6 (0.9 - 12) | 3.7 (1.6 - 10) | 3.3 (1.6 - 6.9) | 0.002 | 0.04 |
| Homocysteine (mmol/mL) | 6.1 (4.5 - 11.7) | 6.2 (4.6 - 13.2) | 6.4 (4.3 - 12.4) | NS | NS |
| Serum pentosidine (μg/mL) | 0.042 (0.022 - 0.065) | 0.043 (0.031 - 0.069) | 0.045 (0.038 - 0.076) | NS | NS |
| Fasting plasma glucose (mg/dL) | 112 (75 - 174) | 100 (88 - 158) | 105 (78 - 161) | NS | NS |
| HbA1c (%) | 6.3 (5.4 - 7.4) | 6.4 (5.5 - 7.3) | 6.2 (5.5 - 7.0) | NS | NS |
| IRI (μU/mL) | 5.31 (2.21 - 10.7) | 5.33 (2.24 - 11.6) | 5.54 (2.28 - 12.8) | NS | NS |
| sCPR (ng/mL) | 1.42 (0.33 - 2.73) | 1.4 (0.88 - 3.09) | 1.47 (0.14 - 2.86) | NS | NS |
| HOMA-IR** | 1.4 (0.5 - 3.2) | 1.3 (0.5 - 2.8) | 1.5 (0.9 - 3.4) | 0.02 | NS |
| HOMA-β** | 45.5 (10.3 - 155) | 41.7 (8.49 - 139) | 45.4 (8.83 - 107) | NS | NS |
| HMW adiponectin (μg/mL) | 3.46 (1.32 - 10.9) | - | 3.37 (1.42 - 12.8) | - | 0.024 |
| LDL cholesterol (mg/dL) | 124 (53.0 - 154) | 107 (58.0 - 151) | 108 (50.0 - 168) | 0.003 | 0.037 |
| HDL cholesterol (mg/dL) | 76.5 (37.0 - 1 06) | 72 (45.0 - 108) | 71 (43.0 - 108) | NS | 0.027 |
| Non-HDL cholesterol (mg/dL) | 130 (64.0 - 167) | 117 (70.0 - 157) | 115 (58.0 - 170) | 0.001 | 0.01 |
| Triglyceride (mg/dL) | 86.5 (44.0 - 258) | 108 (42.0 - 187) | 110 (39.0 - 193) | NS | NS |
| baPWV (cm/s) | |||||
| Rt | 1,884 (1,243 - 2,545) | - | 1,808 (1,201 - 2,972) | - | NS |
| Lt | 1,867 (1,241 - 2,687) | - | 1,836 (1,201 - 3,032) | - | NS |
| hs-CRP (ng/mL) | 431 (86 - 4,520) | 563 (148 - 7,120) | 468 (109 - 4,990) | NS | NS |
| Ferritin (ng/mL) | 96 (7.1 - 256) | - | 90.8 (5.1 - 299) | - | NS |
| AST (IU/L) | 21 (13 - 43) | 21 (11 - 42) | 20 (12 - 63) | NS | NS |
| ALT (IU/L) | 19 (9 - 48) | 17 (7 - 55) | 19 (7 - 64) | NS | NS |
| γ-GTP(IU/L) | 19 (12 - 45) | 18 (11 - 47) | 19 (13 - 47) | NS | NS |
| Serum Cr (mg/dL) | 0.61 (0.39 - 0.82) | 0.61 (0.43 - 0.81) | 0.61 (0.39 - 0.81) | NS | NS |
| UACR (mg/g CRE) | 13.5 (3.7 - 42.8) | - | 10.1 (2.1 - 80.4) | - | NS |
| Cystatin C (mg/L) | 0.59 (0.41 - 0.84) | - | 0.55 (0.33 - 0.87) | - | 0.009 |
| Weight (kg) | 54.5 (42.5 - 70) | 54.6 (42.2 - 69) | 55 (42.3 - 70) | NS | NS |