Journal of Clinical Medicine Research, ISSN 1918-3003 print, 1918-3011 online, Open Access |
Article copyright, the authors; Journal compilation copyright, J Clin Med Res and Elmer Press Inc |
Journal website http://www.jocmr.org |
Original Article
Volume 7, Number 9, September 2015, pages 706-713
Procalcitonin Kinetics in the First 72 Hours Predicts 30-Day Mortality in Severely Ill Septic Patients Admitted to an Intermediate Care Unit
Figures
Tables
Overall population (n = 144) | Death at 30 days | P | ||
---|---|---|---|---|
No (n = 103) | Yes (n = 41) | |||
CHF: chronic heart failure; COPD: chronic obstructive pulmonary disease; MAP: mean arterial pressure; APACHE: Acute Physiology, Age and Chronic Health Evaluation; MEDS: mortality in emergency department sepsis score; SOFA: sepsis-related organ failure assessment score. | ||||
Age (years) | 73 ± 14 | 72.3 ± 14.7 | 74.9 ± 12.9 | 0.32 |
Male | 50 (34.7%) | 37 (35.9%) | 13 (31.7%) | 0.70 |
Comorbidities | ||||
CHF (NYHA class III-IV) | 35 (24.3%) | 25 (24.3%) | 10 (24.4%) | 0.99 |
COPD | 29 (20.1%) | 21 (20.4%) | 8 (19.5%) | 0.99 |
Diabetes | 30 (20.8%) | 23 (22.3%) | 7 (17.1%) | 0.65 |
Chronic renal failure | 26 (18.1%) | 17 (16.5%) | 9 (22.0%) | 0.47 |
Active cancer | 23 (16%) | 13 (12.6%) | 10 (24.4%) | 0.12 |
Hematologic malignancy | 18 (12.5%) | 10 (9.7%) | 8 (19.5%) | 0.16 |
Chronic steroid therapy | 27 (24.1%) | 15 (18.8%) | 12 (37.5%) | 0.05 |
Age-adjusted Charlson comorbidity index | 5.9 ± 2.3 | 5.7 ± 2.4 | 6.5 ± 1.8 | 0.07 |
Chronic total dependence | 42 (29.2%) | 29 (28.1%) | 13 (31.7%) | 0.40 |
Clinical parameters | ||||
Heart rate (bpm) | 97 ± 20 | 96 ± 19 | 99 ± 20 | 0.42 |
Respiratory rate (bpm) | 19.2 ± 6.6 | 18.6 ± 6.7 | 20.7 ± 6.4 | 0.82 |
MAP (mm Hg) | 83.1 ± 15.5 | 83.2 ± 16.5 | 82.8 ± 13.0 | 0.89 |
Temperature (°C) | 37.2 ± 1.0 | 37.2 ± 1.0 | 37.1 ± 0.9 | 0.34 |
PaO2/FiO2 (mm Hg) | 243.8 ± 94.2 | 268.7 ± 85.6 | 192.2 ± 91.5 | < 0.001 |
Indexes of severity | ||||
APACHE-II (points) | 15.8 ± 5.9 | 14.9 ± 5.7 | 17.9 ± 6.2 | < 0.05 |
MEDS (points) | 9.3 ± 4.5 | 8.2 ± 4.1 | 12.2 ± 3.9 | < 0.0001 |
SOFA (points) | 5.7 ± 3.5 | 4.9 ± 3.3 | 7.6 ± 3.2 | < 0.0001 |
Length of stay (days) | 14.6 ± 11.2 | 15.7 ± 11.6 | 11.9 ± 9.9 | 0.52 |
Overall population (n = 144) | Death at 30 days | P | ||
---|---|---|---|---|
No (n = 103) | Yes (n = 41) | |||
WBC: white blood cell count; ProBNP: pro-brain natriuretic peptide; PCT: procalcitonin. | ||||
Laboratory values | ||||
WBC count (1,000/mm3) | 10.4 ± 9.3 | 10.9 ± 8.4 | 11.1 ± 11.3 | 0.54 |
Hemoglobin (g/dL) | 10.7 ± 1.7 | 11.1 ± 2.2 | 10.7 ± 1.9 | 0.29 |
Platelet count (1,000/mm3) | 210 ± 143 | 204 ± 136 | 223 ± 159 | 0.47 |
Creatinine (mg/dL) | 1.7 ± 1.8 | 1.9 ± 1.7 | 1.3 ± 0.7 | 0.67 |
Lactate (mmol/L) | 2.3 ± 1.6 | 2.4 ± 1.9 | 2.1 ± 1.0 | 0.38 |
Cardiac troponin I (μg/L) | 0.3 ± 0.5 | 0.3 ± 0.6 | 0.1 ± 0.3 | 0.21 |
ProBNP (pg/mL) | 9,244 ± 14,805 | 9,613 ± 16,604 | 7,998 ± 7,301 | 0.66 |
PCT on admission (ng/mL) | 28.06 ± 63.29 | 34.1 ± 70.1 | 12.7 ± 33.7 | 0.07 |
PCT at 24 h (ng/mL) | 29.09 ± 63.28 | 33.64 ± 70.05 | 16.81 ± 37.87 | 0.19 |
PCT at 72 h (ng/mL) | 13.48 ± 29.04 | 13.31 ± 31.97 | 13.92 ± 20.21 | 0.91 |
Site and type of infection | ||||
Lung | 74 (51.4%) | 47 (45.6%) | 27 (65.9%) | 0.04 |
Urinary tract | 32 (22.2%) | 30 (29.1%) | 2 (4.9%) | 0.001 |
Gall bladder | 6 (4.2%) | 5 (4.9%) | 1 (2.4%) | 0.67 |
Other | 32 (22.2%) | 21 (20.4%) | 11 (26.8%) | 0.69 |
Septic shock | 51 (35.4%) | 25 (24.3%) | 26 (63.4%) | < 0.0001 |
Nosocomial | 33 (22.9%) | 21 (20.4%) | 12 (29.3%) | 0.27 |
Community acquired | 111 (77.1%) | 82 (79.6%) | 29 (70.7%) | 0.27 |
Isolated agent | ||||
Positive blood cultures | 67 (46.5%) | 49 (47.6%) | 18 (43.9%) | 0.42 |
Gram-positive | 27 (18.7%) | 17 (16.5%) | 10 (24.4%) | 0.26 |
Gram-negative | 30 (20.8%) | 24 (23.3%) | 6 (14.6%) | 0.15 |
Fungi | 3 (2.1%) | 2 (1.9%) | 1 (2.4%) | 0.77 |
Polymicrobial | 7 (4.9%) | 11 (10.7%) | 6 (14.6%) | 0.63 |
Univariate analysis | Multivariate analysis | |||||
---|---|---|---|---|---|---|
HR | 95% CI | P | HR | 95% CI | P | |
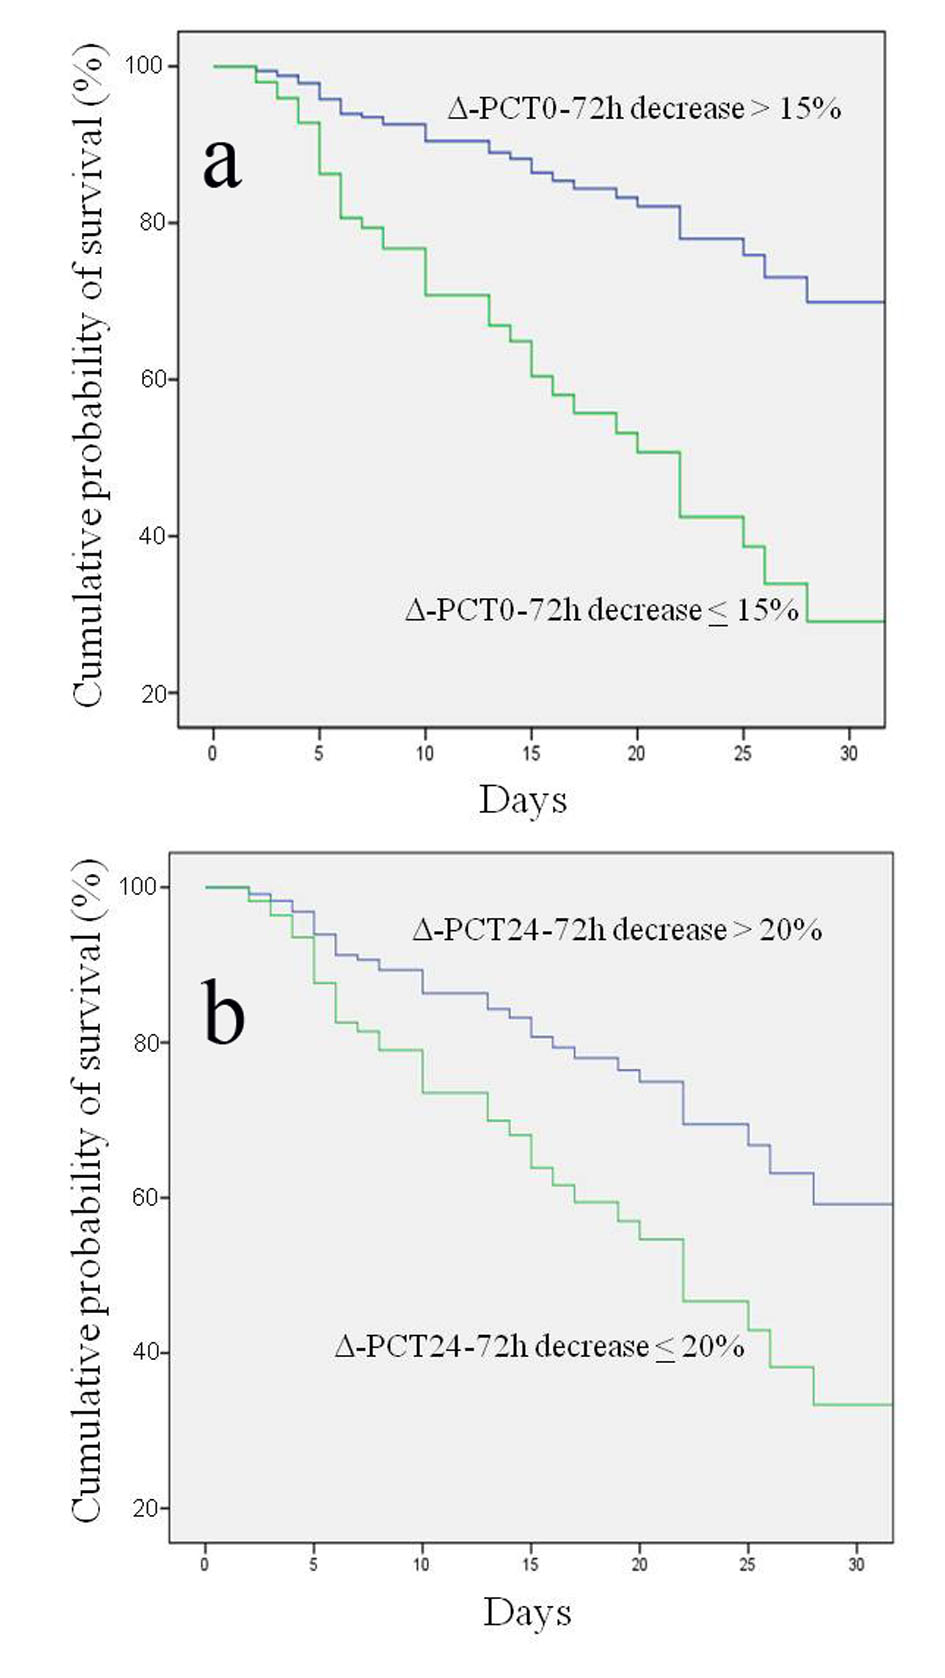
*Age-adjusted Charlson comorbidity index [19]. COPD: chronic obstructive pulmonary disease; MDR: multiple drug-resistant; MAP: mean arterial pressure; MEDS: mortality in emergency department sepsis; SOFA: sepsis-related organ failure assessment; APACHE: acute physiology, age and chronic health evaluation; PCT: procalcitonin. Δ-PCT% variation is the ratio, expressed as percentage, of the difference between the second and the first measurement divided by the first measurement (see “Methods” section for more details). | ||||||
Age | 1.0 | 0.9 - 1.0 | 0.32 | |||
Age more than 75 years | 1.0 | 0.5 - 2.1 | 0.98 | |||
Sex (male vs. female) | 0.8 | 0.4 - 1.8 | 0.70 | |||
Diabetes | 0.7 | 0.3 - 1.8 | 0.48 | |||
Chronic heart failure | 1.0 | 0.4 - 2.3 | 0.98 | |||
COPD | 0.9 | 0.4 - 2.3 | 0.90 | |||
Chronic renal failure | 1.4 | 0.6 - 3.5 | 0.44 | |||
Cancer | 2.2 | 0.9 - 5.6 | 0.87 | |||
Hematologic malignancy | 2.2 | 0.8 - 6.2 | 0.11 | |||
Chronic total dependence | 1.2 | 0.5 - 2.6 | 0.77 | |||
Corticosteroid therapy | 2.6 | 1.0 - 6.4 | 0.04 | |||
Charlson index* | 1.2 | 1.0 - 1.4 | 0.08 | |||
Pneumonia | 2.3 | 1.1 - 4.9 | 0.03 | |||
Polymicrobial sepsis | 2.5 | 1.1 - 5.9 | < 0.05 | |||
MDR bacteria | 2.4 | 0.9 - 6.3 | 0.08 | |||
Nosocomial acquired | 1.6 | 0.7 - 3.7 | 0.27 | |||
Septic shock on presentation | 5.4 | 2.5 - 11.8 | < 0.001 | 5.3 | 2.3 - 12.4 | < 0.0001 |
Antibiotic therapy within 6 h | 0.4 | 0.1 - 1.3 | 0.19 | |||
MEDS | 1.3 | 1.1 - 1.4 | < 0.001 | 1.3 | 1.1 - 1.5 | 0.001 |
SOFA | 1.3 | 1.1 - 1.4 | < 0.001 | |||
SOFA 48 h | 1.3 | 1.1 - 1.6 | < 0.001 | |||
APACHE-II | 1.1 | 1.0 - 1.1 | 0.02 | |||
PCT on admission | 0.9 | 0.9 - 1.0 | 0.09 | |||
PCT at 24 h | 0.9 | 0.9 - 1.0 | 0.22 | |||
PCT at 72 h | 1.0 | 0.9 - 1.0 | 0.90 | |||
Δ-PCT % variation | ||||||
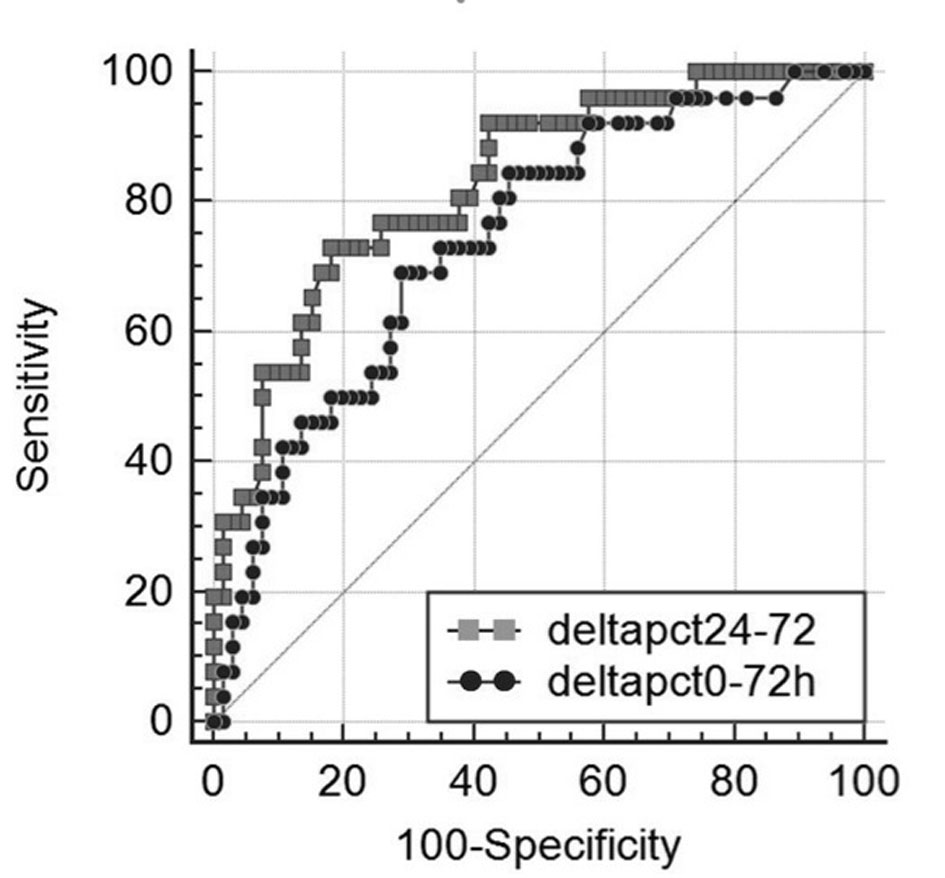
Δ-0-72h decrease < 15% | 6.1 | 2.7 - 13.6 | < 0.0001 | 3.9 | 1.6 - 9.5 | < 0.0001 |
Δ-24-72h decrease < 20% | 5.9 | 2.5 - 14.1 | < 0.0001 | 3.1 | 1.2 - 7.9 | < 0.001 |