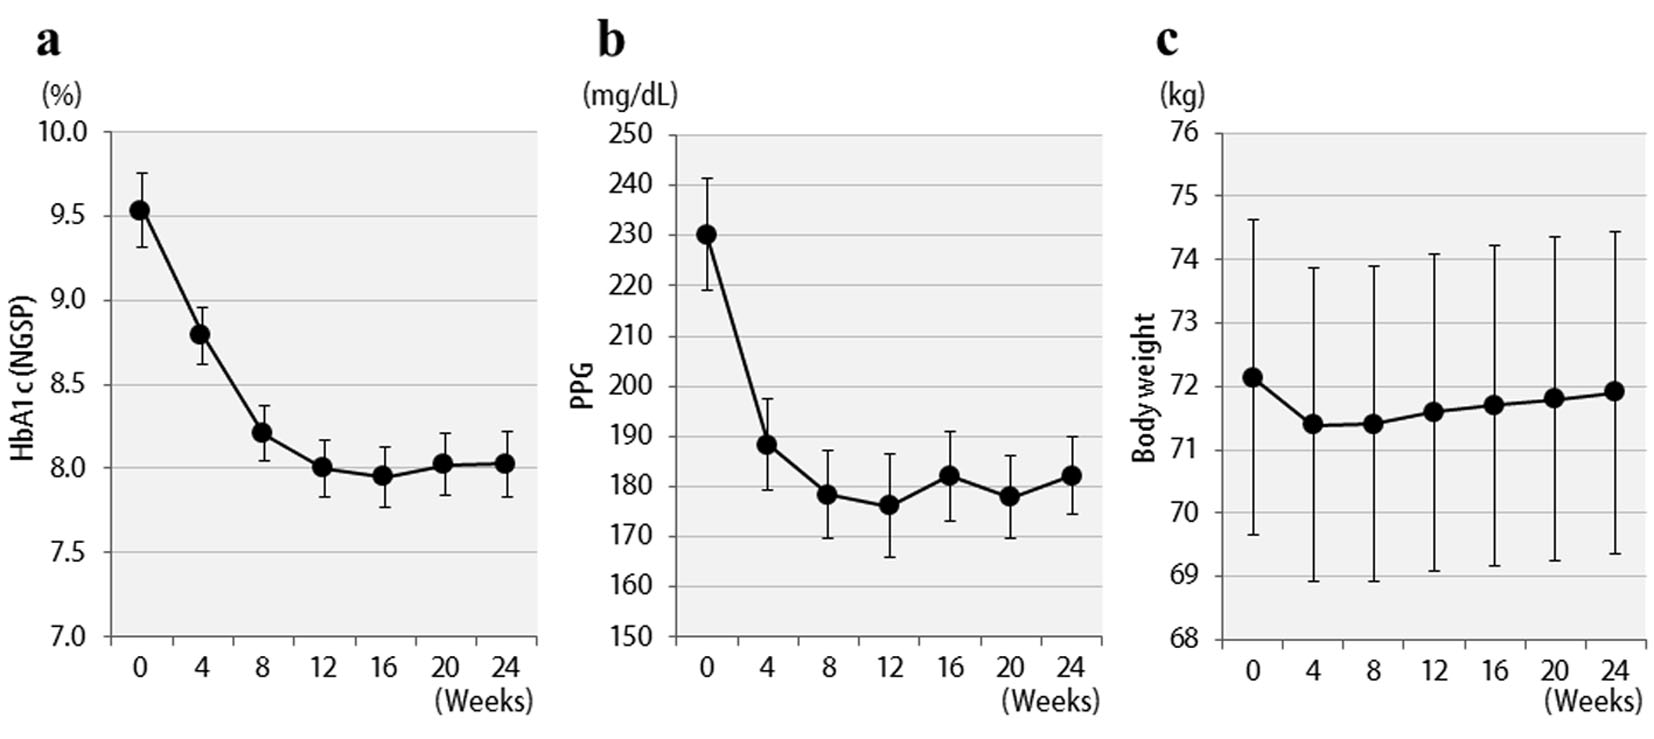
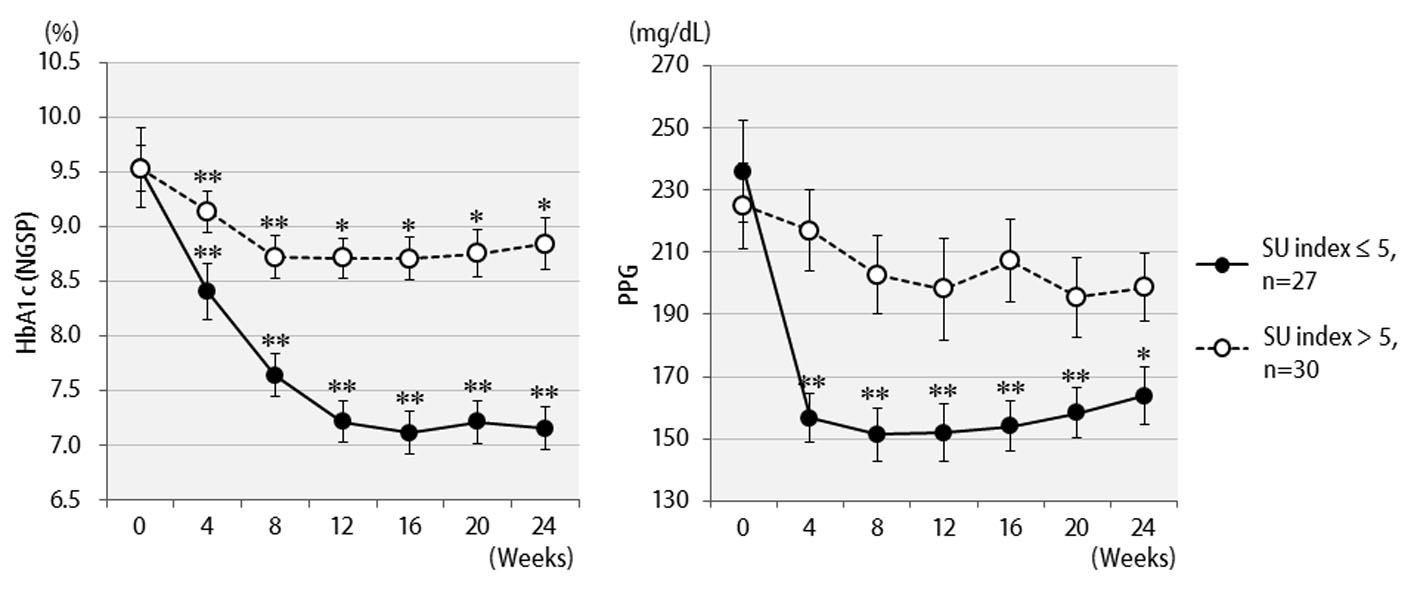
Figure 1. Changes in clinical parameters for 24 weeks after liraglutide treatment in 57 patients: (a) HbA1c (NGSP); (b) 2 h postprandial plasma glucose; (c) body weight.
| Journal of Clinical Medicine Research, ISSN 1918-3003 print, 1918-3011 online, Open Access |
| Article copyright, the authors; Journal compilation copyright, J Clin Med Res and Elmer Press Inc |
| Journal website http://www.jocmr.org |
Original Article
Volume 7, Number 9, September 2015, pages 694-699
Efficacy and Clinical Characteristics of Liraglutide in Japanese Patients With Type 2 Diabetes
Figures

Table
| Number of subjects (male/female) | 30/27 |
| Age (years) | 58.0 ± 12.0 |
| Duration of diabetes (years) | 10.6 ± 6.3 |
| Body weight (kg) | 72.1 ± 18.6 |
| BMI (kg/m2) | 27.9 ± 5.9 |
| HbA1c (NGSP) (%) | 9.5 ± 1.6 |
| 2 h postprandial plasma glucose (mg/dL) | 230.2 ± 83.3 |
| 2 h postprandial CPR (ng/mL) | 3.3 ± 2.0 |