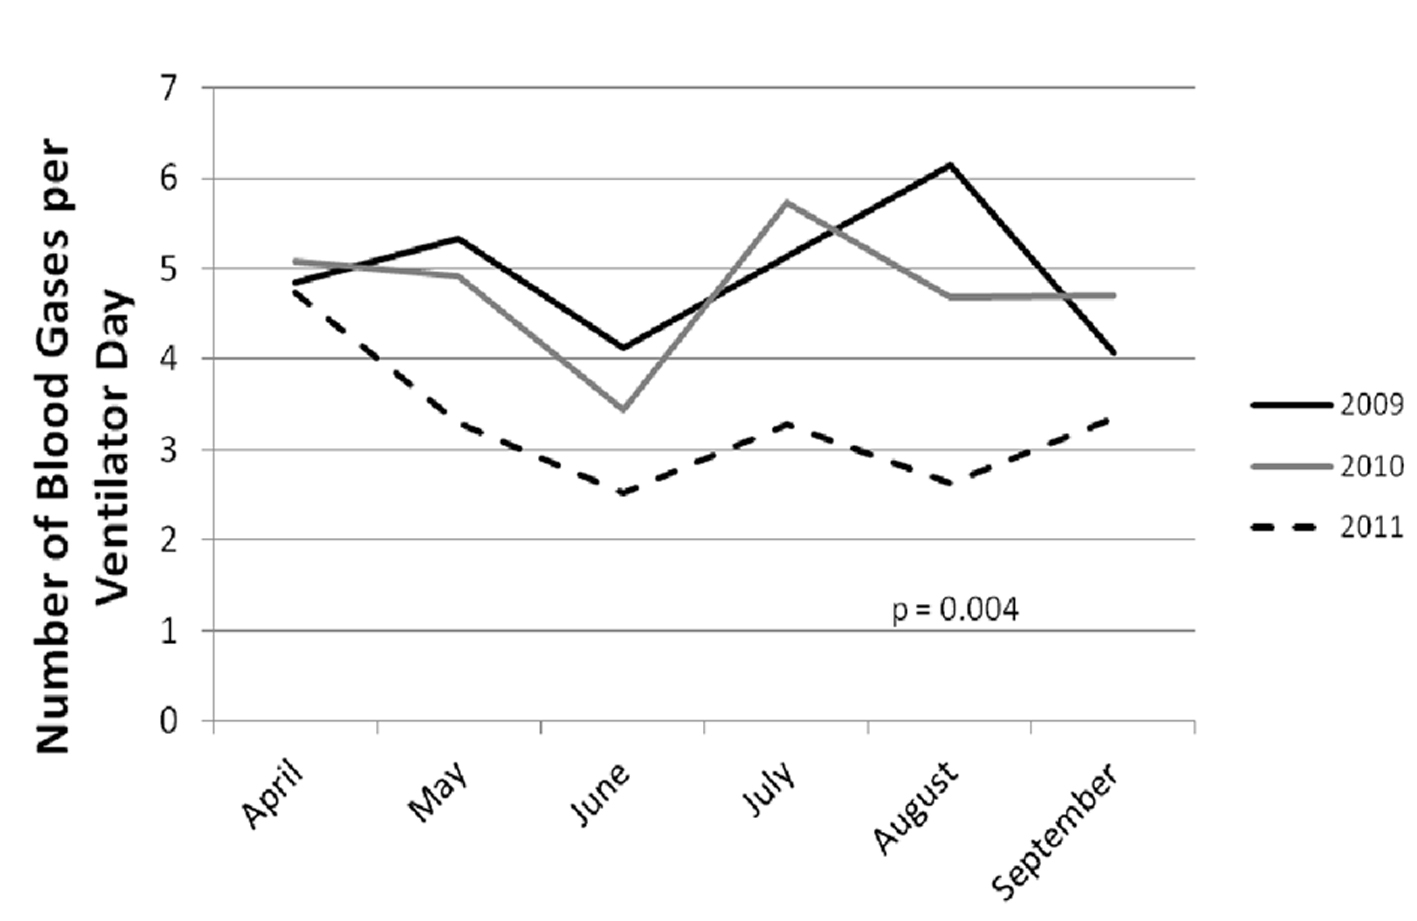
Figure 1. Mean blood gases per day are displayed for each month of the years 2009, 2010, and 2011. It is noted that the average blood gas utilization per day is consistently lower in each month of 2011 than in the preceding 2 years.
| Journal of Clinical Medicine Research, ISSN 1918-3003 print, 1918-3011 online, Open Access |
| Article copyright, the authors; Journal compilation copyright, J Clin Med Res and Elmer Press Inc |
| Journal website http://www.jocmr.org |
Original Article
Volume 7, Number 2, February 2015, pages 71-75
Implementation of Continuous Capnography Is Associated With a Decreased Utilization of Blood Gases
Figure

Tables
| April-September 2009 | April-September 2010 | April-September 2011 | P value | |
|---|---|---|---|---|
| P values obtained from a one-way ANOVA. | ||||
| Total number of blood gases analyzed | 12,937 | 13,171 | 8,070 | 0.001 |
| Average number of blood gases per patient encounter | 20.8 (3.8) | 21.6 (1.4) | 13.8 (1.7) | < 0.0001 |
| Average number of blood gases per ventilator day | 4.94 (0.79) | 4.76 (0.75) | 3.30 (0.79) | 0.004 |
| Charges April-September | Charges in 2010 - 2009 | P-value | ||||||
|---|---|---|---|---|---|---|---|---|
| 2009 | 2010 | 2011 actual* | 2011 converted# | Actual savings | Converted savings | Actual | Converted | |
| Values are means ± standard deviation. Medians are displayed in parenthesis. P values obtained from a one-way ANOVA. *2011 actual are the actual charges for blood gases during the study time period April-September. #2011 converted are the charges re-calculated using the lower 2010 charge per blood gas, i.e. the charge, if there had not been an increase in the price of a blood gas between 2010 and 2011. | ||||||||
| Total charge of blood gases analyzed | $2,207,804 | $2,261,051 | $1,544,360 | $1,380, 556 | $716,691 | $880,495 | 0.02 | 0.005 |
| Charge of blood gas analysis per ventilator day | $839 ± 172 ($830) | $817 ± 129 ($825) | $631 ± 150 ($631) | $564 ± 134 ($564) | $186 | $253 | 0.06 | 0.009 |
| Charge of blood gas analysis per patient encounter | $3,522 ± 241 ($3,242) | $3,716 ± 241 ($3,695) | $2,649 ± 328 ($2,589) | $2,368 ± 293 ($2,313) | $1,067 | $1,348 | 0.007 | 0.001 |