Figures
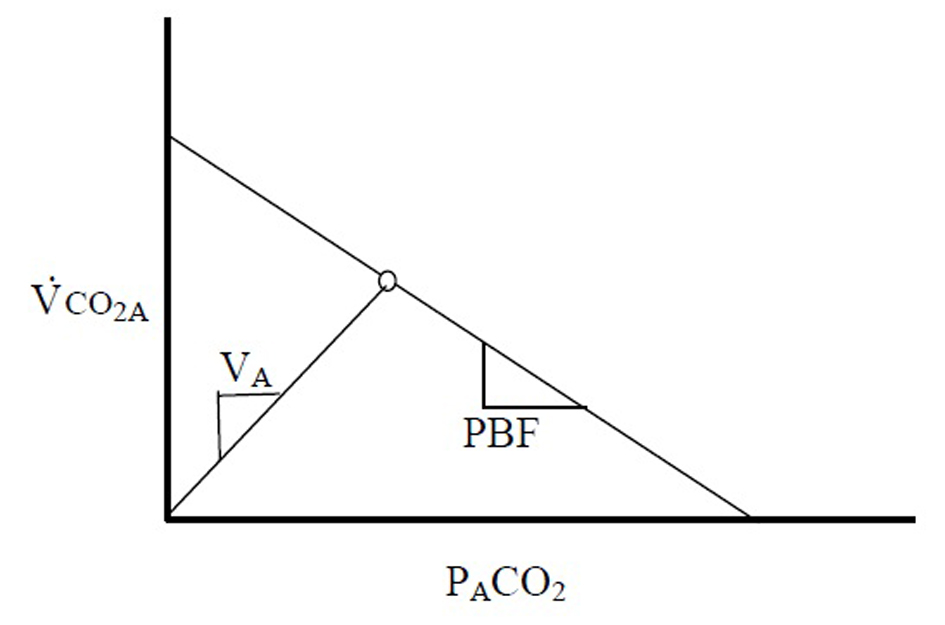
Figure 1. The relationship between VCO2A and PACO2 is linear. The slope of this line is proportional to the pulmonary blood flow. An intersecting line can be drawn from the origin following the relationship VA = VCO2 × PACO2/713. The steady state point (A) for PACO2 and VCO2A is produced by the balance of CO2 diffusion into the alveoli and the flow of blood into the pulmonary capillaries.
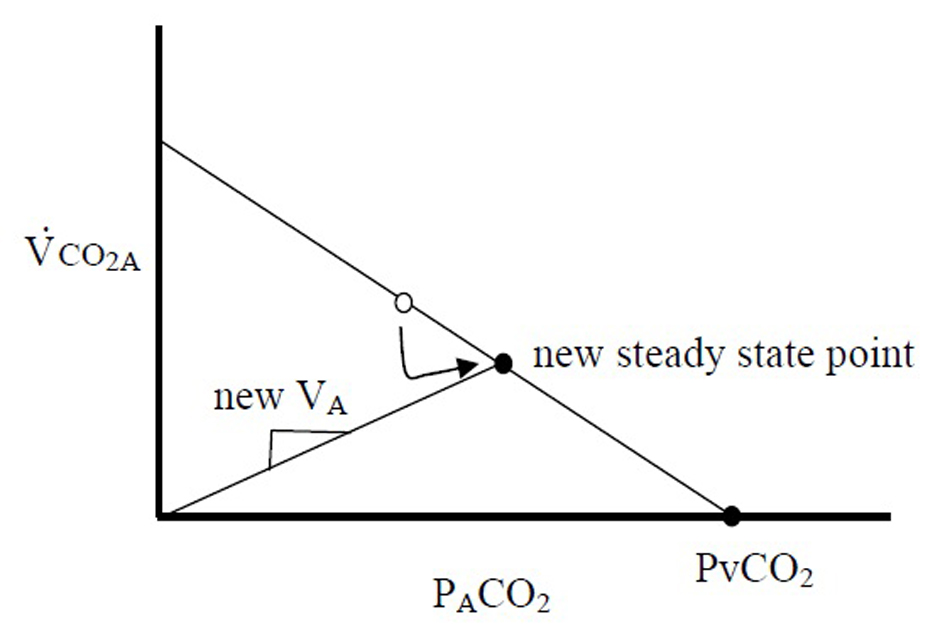
Figure 2. Gedeon’s method of reducing VA for several breaths acutely increases PACO2 and reduces VCO2A creating a new steady state point on the same line. Point A and point B can be used together to calculate the slope of the line, which is the pulmonary blood flow.
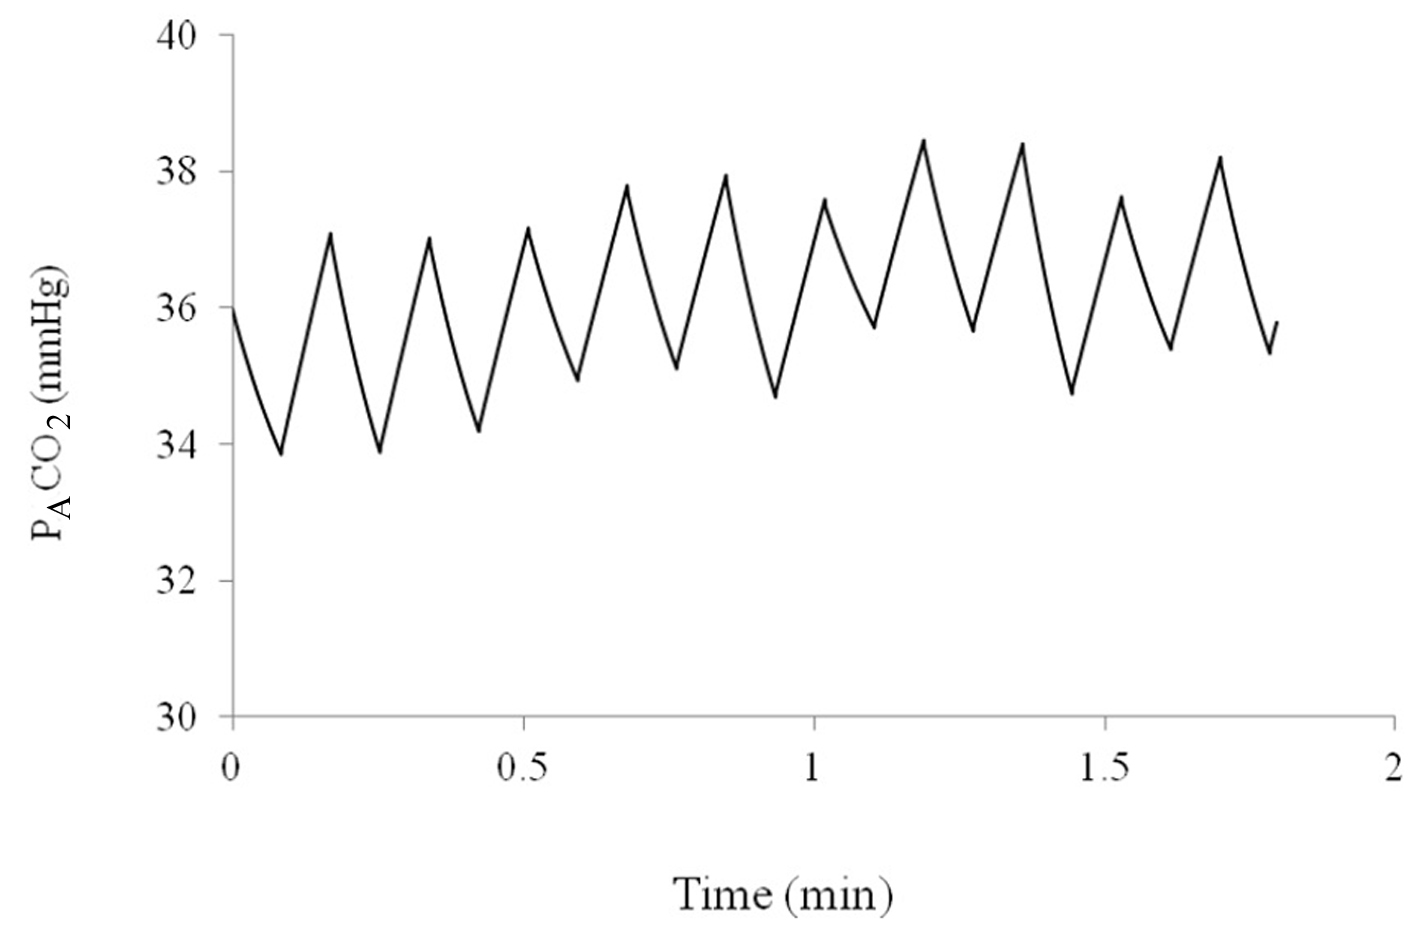
Figure 3. Alveolar partial pressure of CO2 over a period of 2 min as predicted by the computer model.
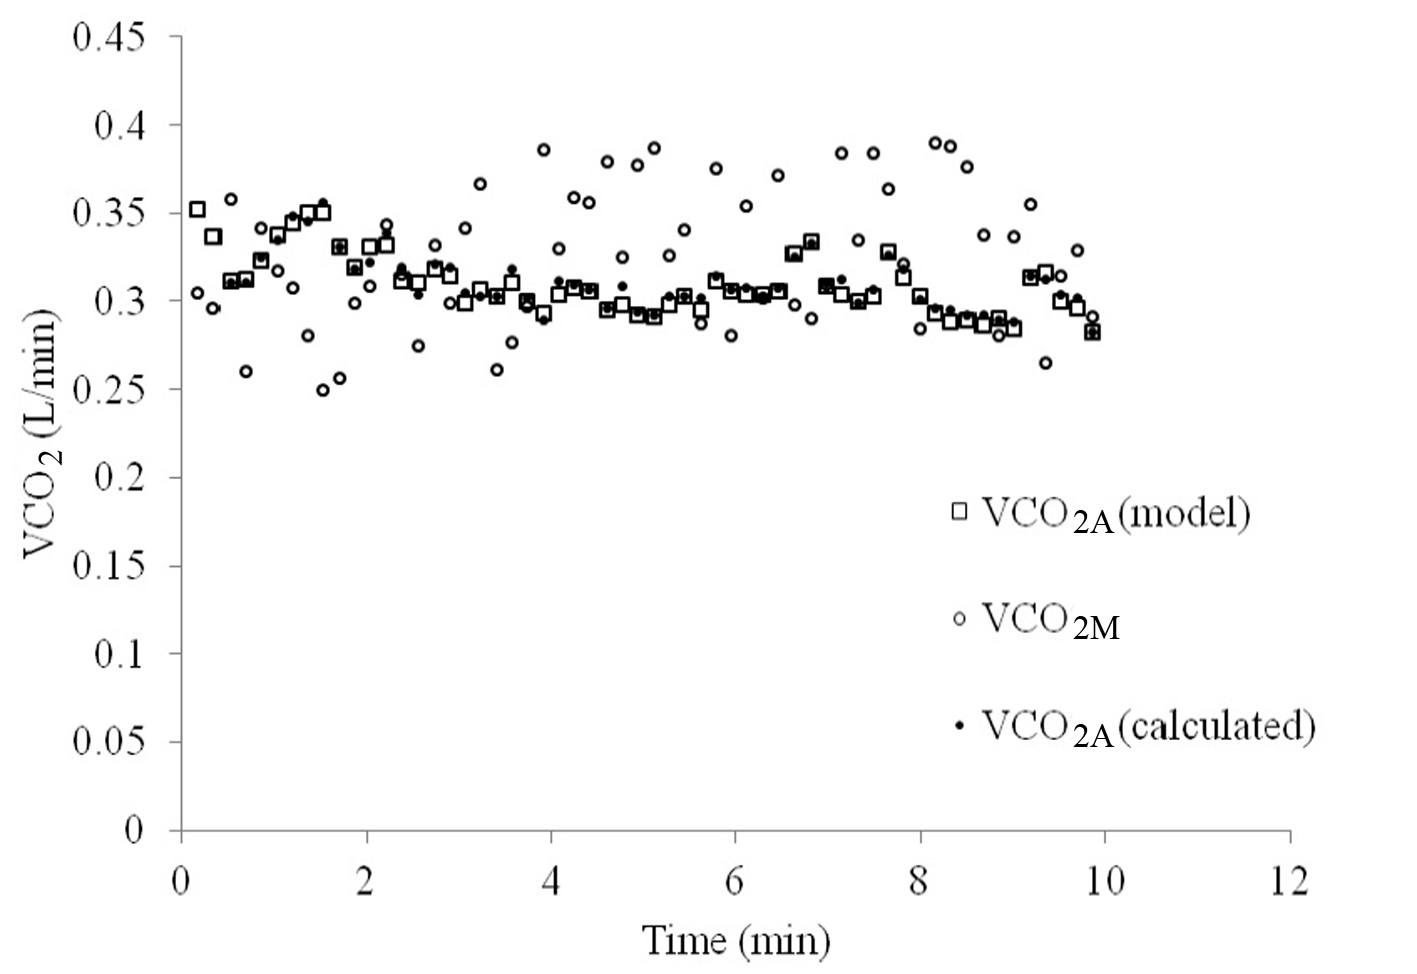
Figure 4. VCO2 over time as measured at the mouth (VCO2M, open circles), as pre-set by the model (VCO2A-model, open squares) and as calculated using the proposed method (VCO2A-calculated, closed circles).
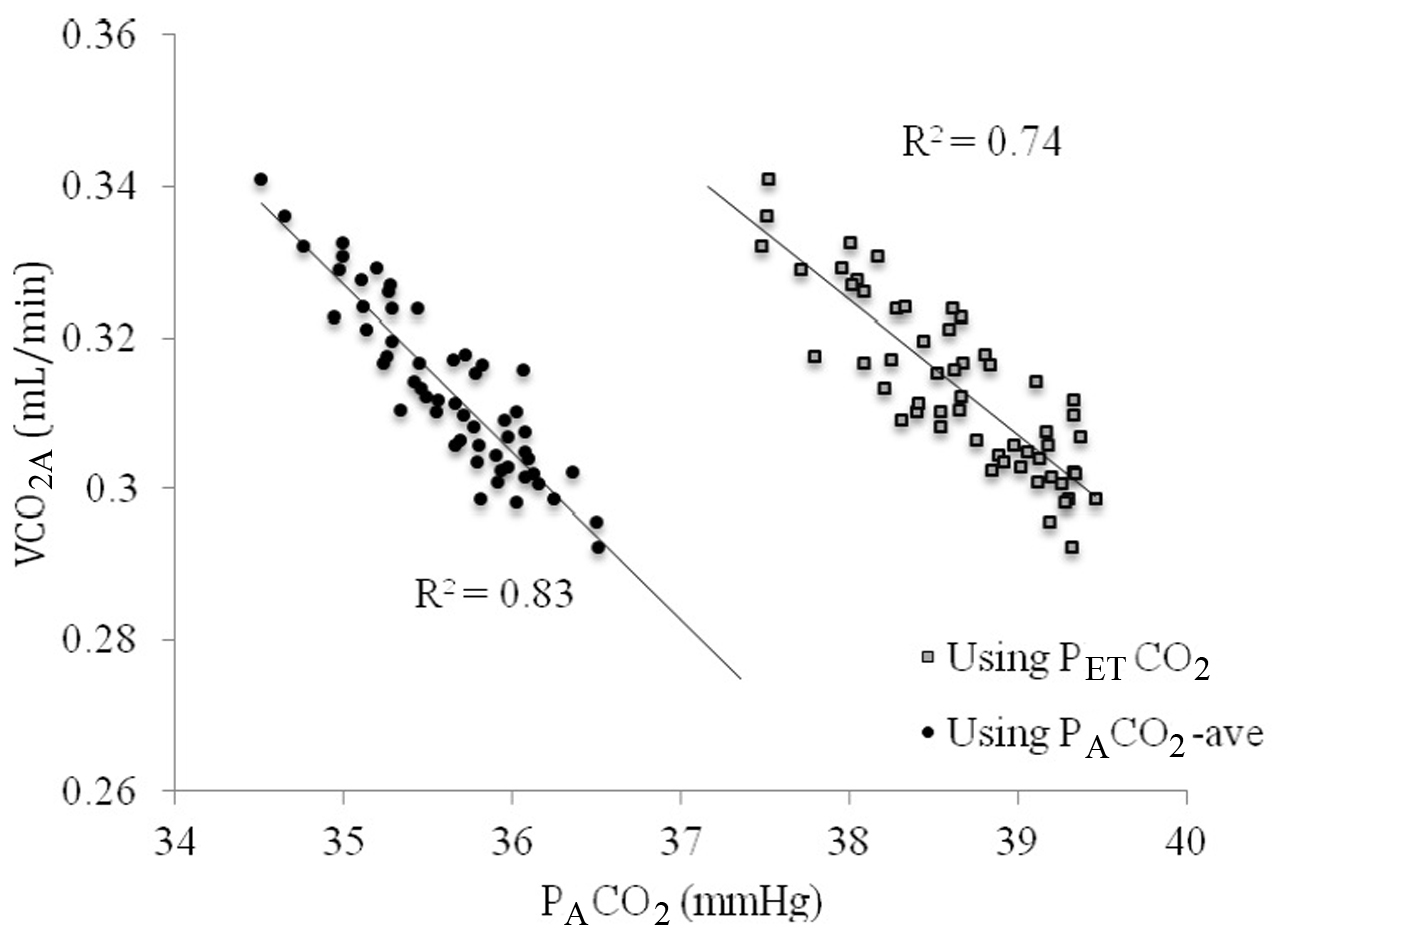
Figure 5. The relationship between VCO2A and PACO2 using end-tidal PCO2 (PETCO2, gray squares) versus time averaged CO2 across the breath (PACO2-ave, closed circles).
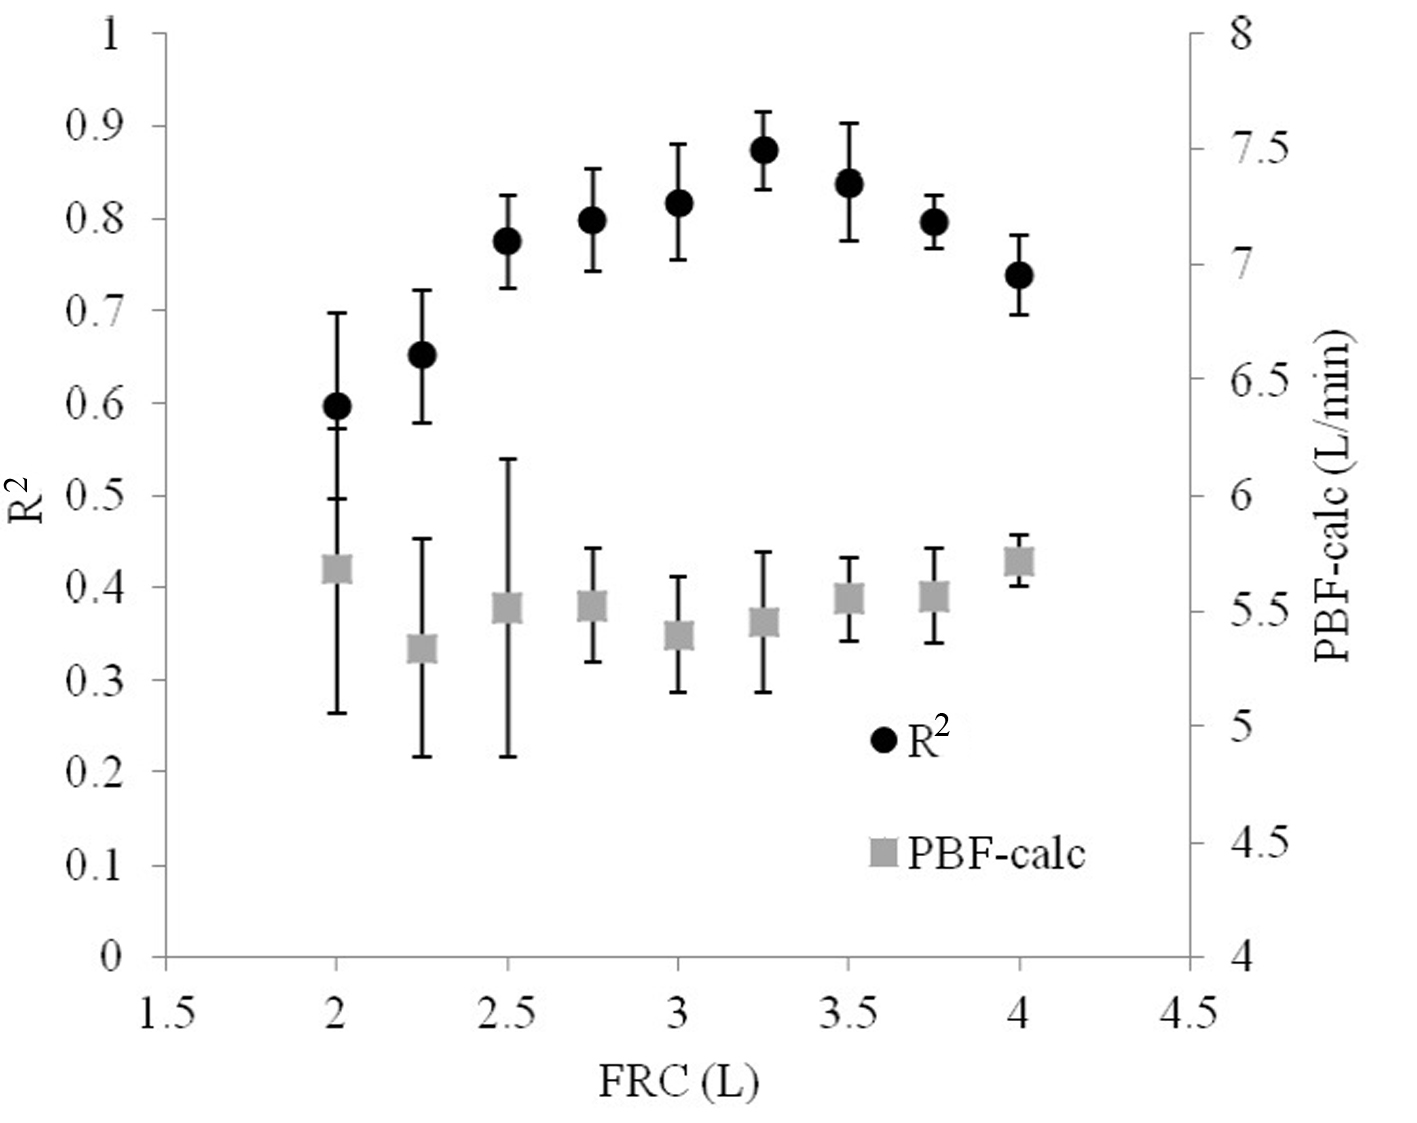
Figure 6. The R2 statistical parameter relating VCO2A to PACO2 varies depending on the original estimate of FRC. As the initial guess of FRC is increased, R2 reaches a peak, optimum point and then falls.
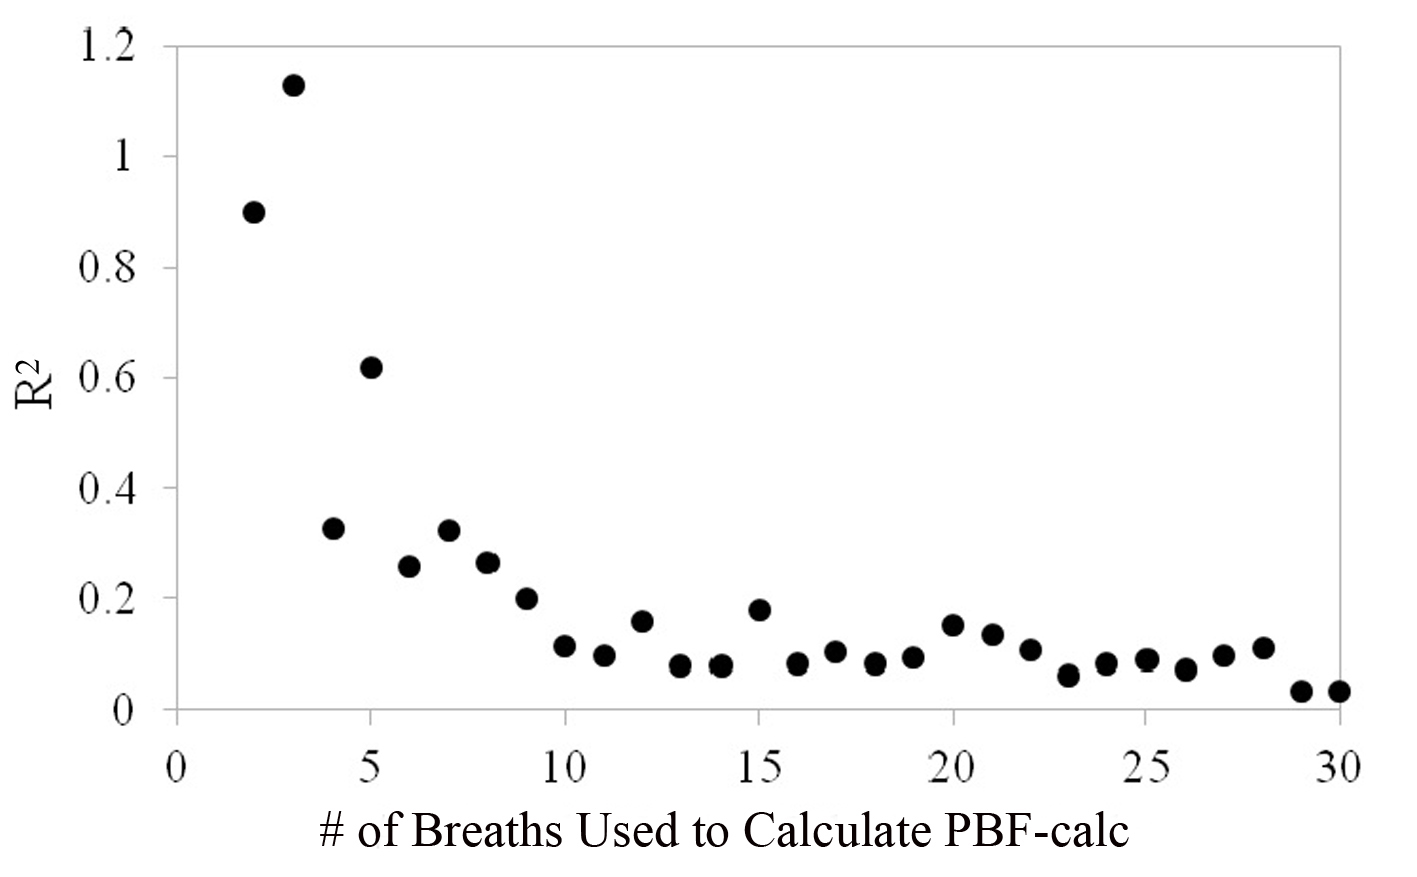
Figure 7. As few as two breaths can be used to calculate PBF but its reliability is increased as more breaths are incorporated into the calculation. Precision reaches a plateau at about 8 - 10 breaths.
Table
Table 1. The Parameters Used in the Mathematical Model
| Parameter | Error | Value |
|---|
| PvCO2 (mm Hg) | None | 50 |
| Pulmonary blood flow (L/min) | None | 6 |
| Tidal volume (mL) | ±30% | 500 |
| Respiratory frequency (/min) | None | 12 |
| FRC (L) | None | 3 |
| PBF-preset (L/min) | None | 6 |


