


| Journal of Clinical Medicine Research, ISSN 1918-3003 print, 1918-3011 online, Open Access |
| Article copyright, the authors; Journal compilation copyright, J Clin Med Res and Elmer Press Inc |
| Journal website http://www.jocmr.org |
Original Article
Volume 10, Number 9, September 2018, pages 715-721
Relationship Between Depression and Stress Coping Ability Among Residents in Japan: A Two-Year Longitudinal Study
Makoto Itoa, b, e, Emiko Seoc, d, Takami Maenoc, Ryoko Ogawad, Tetsuhiro Maenoc, d
aWakaba Home Care Clinic, Tsuchiura, Ibaraki, Japan
bDepartment of General Medicine and Primary Care, University of Tsukuba Hospital, Tsukuba, Ibaraki, Japan
cDepartment of Primary Care and Medical Education, Faculty of Medicine, University of Tsukuba, Tsukuba, Ibaraki, Japan
dCenter for Medical Education and Training, University of Tsukuba Hospital, Tsukuba, Ibaraki, Japan
eCorresponding Author: Makoto Ito, Wakaba Home Care Clinic, 2-9-15 Kidamarihigashidai, Tsuchiura, Ibaraki, 300-0027, Japan
Manuscript submitted June 11, 2018, accepted July 5, 2018
Short title: Medical Trainees’ Mental Health
doi: https://doi.org/10.14740/jocmr3512w
| Abstract | ▴Top |
Background: Depression among medical residents is a critical issue. The early detection of depression and provision of appropriate care is necessary for fostering healthy conditions during clinical training. To investigate whether Sense of Coherence (SOC), an indicator of stress coping ability, could be a predictor of depression 2 years after the start of clinical training, we conducted a national longitudinal study.
Methods: We distributed self-administered questionnaires to residents in 251 postgraduate educational hospitals just before the start of their clinical training. The questionnaire contained the Center for Epidemiologic Studies Depression (CES-D) scale (a screening tool for depression), the SOC scale, and demographic factors. After 2 years, we distributed questionnaires to residents who responded to the first survey. The second questionnaire contained the CES-D scale and questions about working conditions. We categorized respondents into three groups according to their SOC score and analyzed the relationship between SOC groups (low, middle, high) and depressive symptoms on the follow-up survey.
Results: In total, 1,738 of 2,935 residents (59.2%) responded to the first survey. Of these, 1,169 residents (67.3%) also responded to the follow-up survey. A total of 169 residents were excluded because they screened positive for depressive symptoms at the time of the first survey. On the follow-up survey, 187 residents (19.5%) had new-onset depressive symptoms: 33.3% in the low SOC group, 18.2% in the middle SOC group, and 11.4% in the high SOC group (P < 0.01). Compared with the high SOC group, the odds ratio for new-onset depressive symptoms in the low SOC group was 2.04 (95% confidence interval, 1.02 - 4.05) after adjusting for demographic factors, baseline CES-D score, and mean working time.
Conclusions: SOC score is significantly associated with future depressive symptoms among residents after 2 years. Residents in the low SOC group had a 2-fold higher risk of future depressive symptoms than those in the high SOC group. The SOC scale might be a useful predictor of future depression and allow for the provision of appropriate support to residents during clinical training.
Keywords: Depression; Sense of Coherence; Residents; Mental health; Working hours; Postgraduate training
| Introduction | ▴Top |
Medical residency is an important time to learn how to be a skillful doctor. However, it is both physically and mentally stressful and burdensome [1, 2]. Depression, which could lead to a leave of absence, dropping out of medicine, or suicide in worst case, is an important stress reaction and one of the most significant problems [3]. Goebert et al reported that nearly 6% of depressed residents have suicidal ideation [4]. The prevalence of depression among residents is variable, with reports ranging from 7% - 35% [5-8]. However, most studies have found the rate of depression among residents to be higher than that of the general public (4% - 5%) [5, 8, 9]. In fact, we reported that 23.3% of first-year residents who did not have depressive symptoms before the start of training had depressive symptoms after 3 months of clinical training [10].
Depression among residents is also harmful to patients. Fahrenkopf et al reported that depressed residents made 6.2 times as many medical errors per month as residents who were not depressed [11]. Depression in residents is related to medical error, and medical errors may lead to depression, which creates a negative cycle [11].
The early detection of depression and provision of appropriate care is necessary for fostering healthy conditions during clinical training. However, early detection of depression is difficult, regardless of the severity and frequency of depression [12]. If we can identify predictors of groups at high risk for depression, it might help detect depression earlier. Those may support the early detection of depression in residents and facilitate the provision of appropriate support before depression becomes any worse. [13].
Previous studies have suggested some predictive factors for depressive symptoms in residents, such as self-criticism [14], an unhappy childhood [1], and previous mental health problems [8]. However, many residents may hesitate to answer questions about such personal issues, so it might be hard to use these predictive factors to identify residents who are at high risk for depression.
In our previous study, we suggested that residents in the low Sense of Coherence (SOC) group had a 3-fold higher risk of future depressive symptoms than those in the high SOC group at 3 months after of the start of clinical training [10]. SOC is a concept stated by Antonovsky in 1979 that relates to stress coping ability [15]. We can determine an SOC score using a self-administered questionnaire [16]. Persons with high SOC scores have high stress coping ability [16]. Since the SOC score is not the delicate personal information, sharing information about residents among directors and attending physicians was relatively easy, which allowed for the provision of appropriate support.
In this previous study, however, follow-up occurred 3 months after the start of clinical training. Since this was an early time point, it was possible to evaluate acute stress reactions [17].
From the perspective of long term follow-up, SOC scores were associated with the onset of depression among Japanese workers in a previous study with a 1-year follow-up period. The risk ratio for depression with a high SOC score compared to a low SOC score was 0.18 [18]. However, in this previous study, the subjects were not residents, and the follow-up period was just 1 year, which is shorter than the 2 years of a primary residency program.
Since it was unclear that SOC scores could be used as predictors of future depression among residents more than 3 months after the start of clinical training, we conducted a national longitudinal study to investigate whether SOC could be a predictor of future depression 2 years after the start of clinical training.
| Materials and Methods | ▴Top |
Subjects and study design
We contacted 853 postgraduate educational hospitals across Japan using the Residency Electronic Information System (REIS), which is the Japanese government’s database of hospitals providing clinical training, asking the hospitals to participate in our study. We mailed questionnaires to the hospitals that agreed to participate. The clinical training program directors distributed the questionnaires to first-year residents at the orientation session at the beginning of clinical training, March 2011. The questionnaire contained the Center for Epidemiologic Studies Depression (CES-D) scale to evaluate depressive states, the SOC scale, and basic demographic information such as age, sex, and type of training hospital (university hospital or other educational hospital). In addition, we assigned an ID number to each questionnaire, which was also used in the follow-up survey. The ID number was handled separately to protect personal information.
Two years after the start of their training, March 2013, we conducted a follow-up survey of residents who had responded to the first survey. The questionnaire contained the CES-D, mean working hours on weekdays, mean working hours on weekends, and number of night shifts each month.
CES-D
We used the CES-D scale to evaluate depressive symptoms. The CES-D tool consists of 20 items that focus on the experience of depressive symptoms within the last week [19]. Using a scale of 0 - 3, respondents rate all 20 items to produce a final score in the range of 0 - 60 [19]. We used the Japanese version of the CES-D, which has confirmed reliability and validity [20]. Using a cut-off level of 16 points, the sensitivity is 88.2% and specificity is 84.8% for depressive symptoms [20]; and we defined a person with a score ≥16 as screen-positive for depressive symptoms.
SOC scale
We used the Japanese version of the SOC questionnaire, which consists of 13 items rated using a 5-point scale, which has certified reliability and validity [21]. We classified residents into three groups by overall SOC score. Because there is no definitive cut-off point for the SOC scale, we used the mean and standard deviation (SD) of the overall SOC score to define the groups, as in previous studies [10, 22]. Groups were as follows: low SOC group, SOC score < mean - SD; high SOC group, SOC score > mean + SD; middle SOC group, SOC score within 1 SD of the mean.
Mean working time
As in previous studies [22, 23], it might be difficult for residents to report the mean number of work hours per week directly because many count their working time by day, so the mean number of working hours was calculated using the following equation with three components: mean working time on weekdays, mean working time on weekends, and number of night shifts each month.
Mean weekly working hours = 5 × (mean working hours on weekdays) + 2 × (mean working hours on weekends) + 7/30 (monthly number of night shifts) (24 - mean working hours on weekdays)
Mean weekly working time was defined as the sum of 5 times the mean daily working time on weekdays, plus 2 times the mean daily working time on weekends, plus the mean working time for night shifts. The questionnaire included the number of night shifts per month, so we re-calculated this value as the number of night shifts per week. We calculated the working time for each night shift as 24 h minus the mean daily working time on weekdays.
Statistical analysis
We included residents who answered both the first survey and the follow-up survey. We excluded persons with any missing SOC, CES-D, or demographical data. To evaluate how medical training influences mental health as a stress factor, we also excluded residents who already had depressive symptoms at the time of the first survey, i.e., before starting clinical training. Residents who did not have depressive symptoms on the first survey but had depressive symptoms on the follow-up survey were defined as having new-onset depressive symptoms.
To reveal any associations between new-onset depressive symptoms and SOC group, baseline CES-D score, demographic factors, and working hours, we used Chi-square tests or t-tests for univariate analysis. We conducted logistic regression analysis for new-onset depressive symptoms to adjust confounding factors, using demographical information and variables with P-values less than 0.10 in the univariate analysis as independent variables. The significant level was set at P < 0.05. All statistical analyses were conducted using SPSS version 22.0 (IBM Japan Ltd., Tokyo, Japan).
Ethical considerations
The study was approved by the Ethics Committee of the Faculty of Medicine of the University of Tsukuba (No. 77). The purpose of this study and measures to protect data security were stated on the first page of the questionnaire. At the same time, we explained that participation in this study was voluntary. The data were de-identified prior to statistical analysis to protect personally identifiable information.
| Results | ▴Top |
Characteristics of study participants
In total, 251 hospitals participated in our study, and we distributed questionnaires to 2,935 residents. For the first survey, 1,738 residents responded (59.2%). Of these, 1,169 residents (67.3%) responded to the follow-up survey. Data were missing for 43 respondents for the follow-up survey, so we excluded them. Of the remaining 1,126 residents, 169 residents (15.0%) already had depressive symptoms at the time of the first survey, so we also excluded them. Finally, 957 residents (32.6%) were included in the analysis. The number of male residents was 621(64.9%). Mean working time was 72.7 ± 15.2 h/week and 28.5% of residents worked more than 80 h per week. Demographic factors, mean SOC score and category, and mean working time are shown in Table 1.
 Click to view | Table 1. Participant Characteristics, Mean SOC Score, SOC Category, and Mean Working Time (N = 957) |
SOC grouping
Mean SOC score was 44.3 ± 6.0 (range 18 - 65). In the low SOC group, there were 147 residents (15.4%), compared with 670 residents (70.0%) in the middle SOC group, and 140 residents (14.6%) in high SOC group.
New-onset depressive symptoms
On the follow-up survey, 187 (19.5%) residents had new-onset depressive symptoms. The mean age was 26.3 ± 3.9 years; 122 were male (65.2%). The mean SOC score was 42.1 ± 6.2. Demographic factors, mean SOC score and category, and mean working time of residents with and without new-onset depressive symptoms are shown in Table 2.
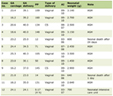
Click to view | Table 2. New-Onset Depressive Symptoms vs. Demographic Factors, SOC Score, Baseline CES-D Score, and Mean Working Time (N = 957) |
In univariate analyses investigating the association between new-onset depressive symptoms versus demographic factors, baseline CES-D score, and working time, only CES-D score at baseline (6.5 ± 4.0 vs. 8.8 ± 3.7 for absence vs. presence of new-onset depressive symptoms; P < 0.01) was significant. Low CES-D scores at baseline seemed to be low risk for development of new-onset depressive symptoms. There were no significant differences by sex (Table 2).
Relationship between new-onset depressive symptoms and SOC score
The mean SOC score was significantly lower in residents with new-onset depressive symptoms compared with residents without new-onset depressive symptoms at follow-up (P < 0.01) (Table 2). In the low SOC group, 33.3% of residents had new-onset depressive symptoms, compared to 18.2% in the middle SOC group and 11.4% in the high SOC group (P < 0.01) (Fig. 1).
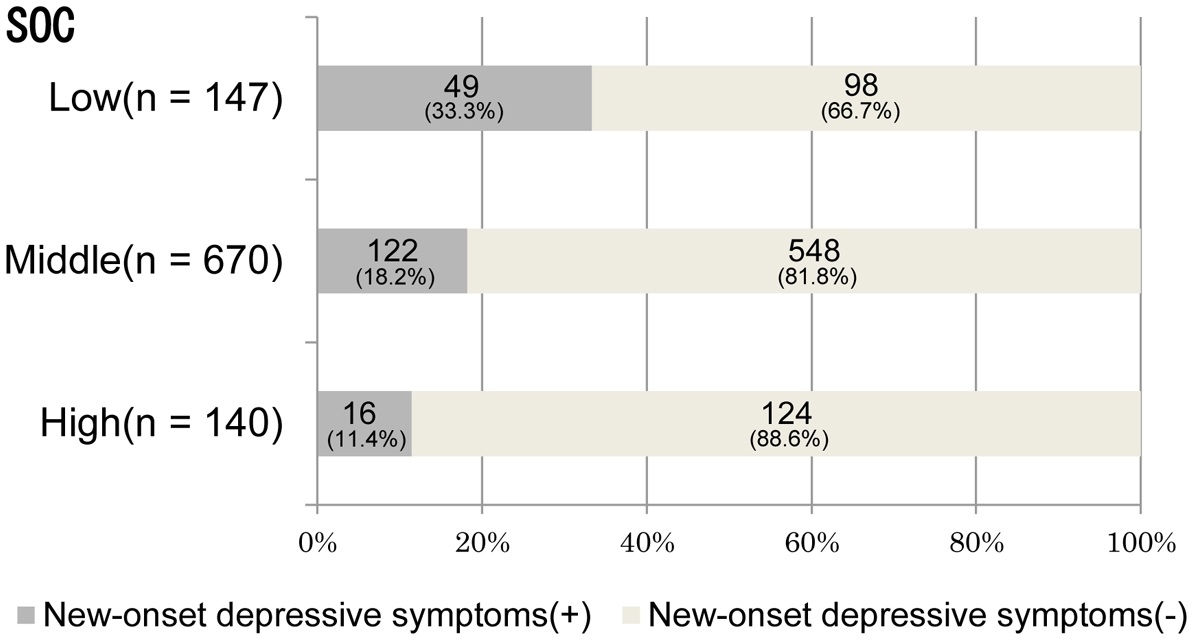 Click for large image | Figure 1. Figure 1. Relationship between the number of residents with new-onset depressive symptoms and SOC group (N = 957). SOC: sense of coherence. Chi-square P < 0.01. |
Logistic regression analysis
We present the results of multivariate logistic regression analysis for new-onset depressive symptoms in Table 3. We included SOC group, age, sex, hospital type, and mean working time as independent variables in the model. Compared to the high SOC group, the adjusted odds ratio for new-onset depressive symptoms in the low SOC group was 2.04 (95% confidence interval (CI), 1.02 - 4.05). Weekly working time was also significantly associated with new-onset depressive symptoms, and its odds ratio was 1.01 (95% CI, 1.00 - 1.03).
Click to view | Table 3. Association Between New-Onset Depressive Symptoms and SOC Score (N = 890) |
| Discussion | ▴Top |
In the present longitudinal study, after adjusting for CES-D score at baseline and mean working time, the SOC score was independently associated with new-onset depressive symptoms. Compared to the high SOC group, the odds of having new-onset depressive symptoms were 2.04 times higher in the low SOC group, even 2 years after the start of clinical training.
In our previous study, we suggested that SOC could be a predictor of future depressive symptoms among residents [10]. The follow-up period was, however, just 3 months, so it remained unclear that it could apply to the 2 years of a primary residency program. In a previous study of workers in a software development company in Tokyo, Japan, with a long follow-up period, Sairenchi et al reported that SOC was a predictor of future depression after 1 year [18]. In this previous study, with the low SOC group as the reference group, the odds ratio for future depression in the high SOC group was 0.18. To the best of our knowledge, the period of 1 year in this previous study was the longest investigation of the association between SOC and depression. Since we suggested SOC is a predictor of future depressive symptoms 2 years after the start of clinical training in the present study, it would be valuable to identify groups at high risk for future depressive symptoms over a longer period than the previous study.
In the previous study of Sairenchi et al [18], the subjects were workers, whereas in our present study the subjects were resident physicians. Among residents, several studies have found the rate of depression to be much higher than that of the general public [5-9, 24]. Thus, SOC could help identify groups at high risk for depression and help provide of appropriate care.
Logistic regression analysis showed that mean weekly working time is significantly associated with new-onset depressive symptoms. The Accreditation Council for Graduate Medical Education (ACGME) strictly limits working time per week to 80 h per week [25]. Although standards and context differ by country, the fact that 28.5% of residents worked for more than 80 h per week is a very important concern. Stronger enforcement of working time in educational hospitals is needed.
The SOC scale is a quick and easy-to-use tool. Furthermore, the SOC scale has been translated into more than 10 languages [16], so it would be feasible to use in many educational hospitals. Since the SOC scale yields a score, residents would not be as likely to hesitate in giving answers for questions about previously identified factors such as self-criticism, unhappy childhood, and history of mental health problems.
Since a low SOC score could be a predictor for groups at high risk for future depressive symptoms, we could monitor high-risk groups carefully and detect early signs of depressive symptoms [13]. At the same time, we could provide appropriate care for high-risk group such as raising the issue with directors and attending physicians [3] and providing frequent short-term counseling [13].
Although the SOC scale can be a useful tool, we should be careful when using the SOC scale. While the odds ratio of the low SOC group for new-onset depressive symptoms was 2-fold higher than that of the high SOC group, 18.2% of residents in the middle SOC group had new-onset depressive symptoms and 11.4% of residents in the high SOC group had new-onset depressive symptoms (shown in Figure 1). Depression seems to be influenced by many factors, so a comprehensive preventive strategy for depression is needed for all residents. When we share the SOC score of residents among attending physicians, attending physicians should not develop prejudice against residents or divulge this information to others. The SOC must be used appropriately as delicate personal information.
This study has some limitations. First, we included residents who responded to both the first and follow-up survey. It is possible that residents who responded to our questionnaire would be more interested in topics such as working conditions, mental health, and depression, which could lead to sampling bias. On the contrary, it is possible that severely depressed residents could not respond to both surveys, causing loss of interest for everything. Hence, we might overestimate or underestimate the number of residents with new-onset depressive symptoms. Second, only 251 (29.4%) of 853 hospitals participated in this study, which is a relatively small number. However the locations of hospitals that participated in this study were geographically representative of Japan. Third, increasing the length of the study might strengthen the results, but we should consider potential limitations in external validity if the findings were to be extrapolated to other nations with longer residency programs. Fourth, since we categorized residents into three groups using the mean score ± SD, 70% were categorized in the middle SOC group, which might have affected the results of the regression analysis. In a previous study, the authors categorized subjects based on SOC score tertiles into three groups [26]. In practice, because the distribution of SOC scores is likely to be different in different populations, the SOC score should not be evaluated as an absolute value. Instead, it should be evaluated as a relative value within a population [15, 16]. Since this present study is part of a series of studies about depression among medical residents, we used the mean score ± SD to categorize subjects into three groups as we did in our previous study [10]. We believe that further research about categorization by SOC score is needed.
Finally, we used a self-administered questionnaire and defined residents who had a CES-D score of ≥ 16 as screening positive for depressive symptoms, which may not always correspond to a clinical diagnosis of depression. However, the prevalence of depressive symptoms was 15.0% at the baseline survey, which was similar to the 15.2% prevalence of depressive symptoms in a study using the CES-D scale translated into Japanese [20]. These observations lend credence to the value and accuracy of our self-administered questionnaire.
Conclusions
The SOC score is significantly related to future depressive symptoms among medical residents 2 years after the start of clinical training. The SOC scale might be a useful predictor of future depression that can allow for the provision of appropriate support to prevent depression throughout the 2 years of a primary residency program.
Acknowledgments
The authors wish to acknowledge all medical residents and training program coordinators for their generous cooperation.
Declaration
The datasets generated and/or analyzed during the current study are available from the corresponding author on reasonable request.
Conflict of Interest
The authors declare that they have no competing interest.
Author Contributions
MI contributed to data analysis and interpretation, and the drafting of the manuscript. ES contributed to study concept and design, data acquisition and analysis, interpretation, and revision of the manuscript. OR contributed to data acquisition and analysis, interpretation of results, and revision of the manuscript. TaM contributed to data analysis and interpretation, and the revision of the manuscript. TeM contributed to study concept and design, revision of the manuscript, and final approval of the published version.
Grant Support
This work was supported in part by a grant from the Ministry of Education, Culture, Sports, Science and Technology of Japan (Grant no. 22590452).
| References | ▴Top |
- Tyssen R, Vaglum P, Gronvold NT, Ekeberg O. Factors in medical school that predict postgraduate mental health problems in need of treatment. A nationwide and longitudinal study. Med Educ. 2001;35(2):110-120.
doi pubmed - Sakata Y, Wada K, Tsutsumi A, Ishikawa H, Aratake Y, Watanabe M, Katoh N, et al. Effort-reward imbalance and depression in Japanese medical residents. J Occup Health. 2008;50(6):498-504.
doi pubmed - Levey RE. Sources of stress for residents and recommendations for programs to assist them. Acad Med. 2001;76(2):142-150.
doi pubmed - Goebert D, Thompson D, Takeshita J, Beach C, Bryson P, Ephgrave K, Kent A, et al. Depressive symptoms in medical students and residents: a multischool study. Acad Med. 2009;84(2):236-241.
doi pubmed - Tyssen R, Vaglum P, Gronvold NT, Ekeberg O. The impact of job stress and working conditions on mental health problems among junior house officers. A nationwide Norwegian prospective cohort study. Med Educ. 2000;34(5):374-384.
doi pubmed - Stoen Grotmol K, Gude T, Moum T, Vaglum P, Tyssen R. Risk factors at medical school for later severe depression: a 15-year longitudinal, nationwide study (NORDOC). J Affect Disord. 2013;146(1):106-111.
doi pubmed - Katz ED, Sharp L, Ferguson E. Depression among emergency medicine residents over an academic year. Acad Emerg Med. 2006;13(3):284-287.
doi pubmed - Sen S, Kranzler HR, Krystal JH, Speller H, Chan G, Gelernter J, Guille C. A prospective cohort study investigating factors associated with depression during medical internship. Arch Gen Psychiatry. 2010;67(6):557-565.
doi pubmed - Murphy JM, Laird NM, Monson RR, Sobol AM, Leighton AH. A 40-year perspective on the prevalence of depression: the Stirling County Study. Arch Gen Psychiatry. 2000;57(3):209-215.
doi pubmed - Ito M, Seo E, Ogawa R, Sanuki M, Maeno T, Maeno T. Can we predict future depression in residents before the start of clinical training? Med Educ. 2015;49(2):215-223.
doi pubmed - Fahrenkopf AM, Sectish TC, Barger LK, Sharek PJ, Lewin D, Chiang VW, Edwards S, et al. Rates of medication errors among depressed and burnt out residents: prospective cohort study. BMJ. 2008;336(7642):488-491.
doi pubmed - Hochberg MS, Berman RS, Kalet AL, Zabar SR, Gillespie C, Pachter HL. The stress of residency: recognizing the signs of depression and suicide in you and your fellow residents. Am J Surg. 2013;205(2):141-146.
doi pubmed - Brooks SK, Gerada C, Chalder T. Review of literature on the mental health of doctors: are specialist services needed? J Ment Health. 2011;20(2):146-156.
doi pubmed - Brewin CR, Firth-Cozens J. Dependency and self-criticism as predictors of depression in young doctors. J Occup Health Psychol. 1997;2(3):242-246.
doi pubmed - Antonovsky A. Health, stress and coping. San Francisco, CA: Jossey-Bass; 1979.
- Antonovsky A. The structure and properties of the sense of coherence scale. Soc Sci Med. 1993;36(6):725-733.
doi - Stress and impairment during residency training: strategies for reduction, identification, and management. Resident Services Committee, Association of Program Directors in Internal Medicine. Ann Intern Med. 1988;109(2):154-161.
doi pubmed - Sairenchi T, Haruyama Y, Ishikawa Y, Wada K, Kimura K, Muto T. Sense of coherence as a predictor of onset of depression among Japanese workers: a cohort study. BMC Public Health. 2011;11:205.
doi pubmed - Radllof L. The CES-D scale: a self-report depression scale for research in the general population. Applied Psychol Meas. 1977;1(3):285-401.
doi - Shima S, Shikano T, Kitamura T, Asai M. New self-rating scales for depression. [in Japanese] Seisin Igaku. 1985;27(6):717-723.
- Togari T, Yamazaki Y. Examination of the reliability and factor validity of 13-item five-point version Sense of Coherence Scale. [in Japanese] Japanese Journal of Health and Human Ecology. 2005;71(4):168-82.
doi - Haoka T, Sasahara S, Tomotsune Y, Yoshino S, Maeno T, Matsuzaki I. The effect of stress-related factors on mental health status among resident doctors in Japan. Med Educ. 2010;44(8):826-834.
doi pubmed - Terry DP, Brassil M, Iverson GL, Panenka WJ, Silverberg ND. Effect of depression on cognition after mild traumatic brain injury in adults. Clin Neuropsychol. 2018:1-13.
doi pubmed - Mata DA, Ramos MA, Bansal N, Khan R, Guille C, Di Angelantonio E, Sen S. Prevalence of depression and depressive symptoms among resident physicians: a systematic review and meta-analysis. JAMA. 2015;314(22):2373-2383.
doi pubmed - Vetto JT, Robbins D. Impact of the recent reduction in working hours (the 80 hour work week) on surgical resident cancer education. J Cancer Educ. 2005;20(1):23-27.
doi pubmed - Kawamura Y, Takayashiki A, Ito M, Maeno T, Seo E, Maeno T. Stress factors associated with burnout among attending physicians: a cross-sectional study. J Clin Med Res. 2018;10(3):226-232.
doi pubmed
This article is distributed under the terms of the Creative Commons Attribution Non-Commercial 4.0 International License, which permits unrestricted non-commercial use, distribution, and reproduction in any medium, provided the original work is properly cited.
Journal of Clinical Medicine Research is published by Elmer Press Inc.